
Insight
You can view sales statistics for the items that you create in the Item statistics dashboard.
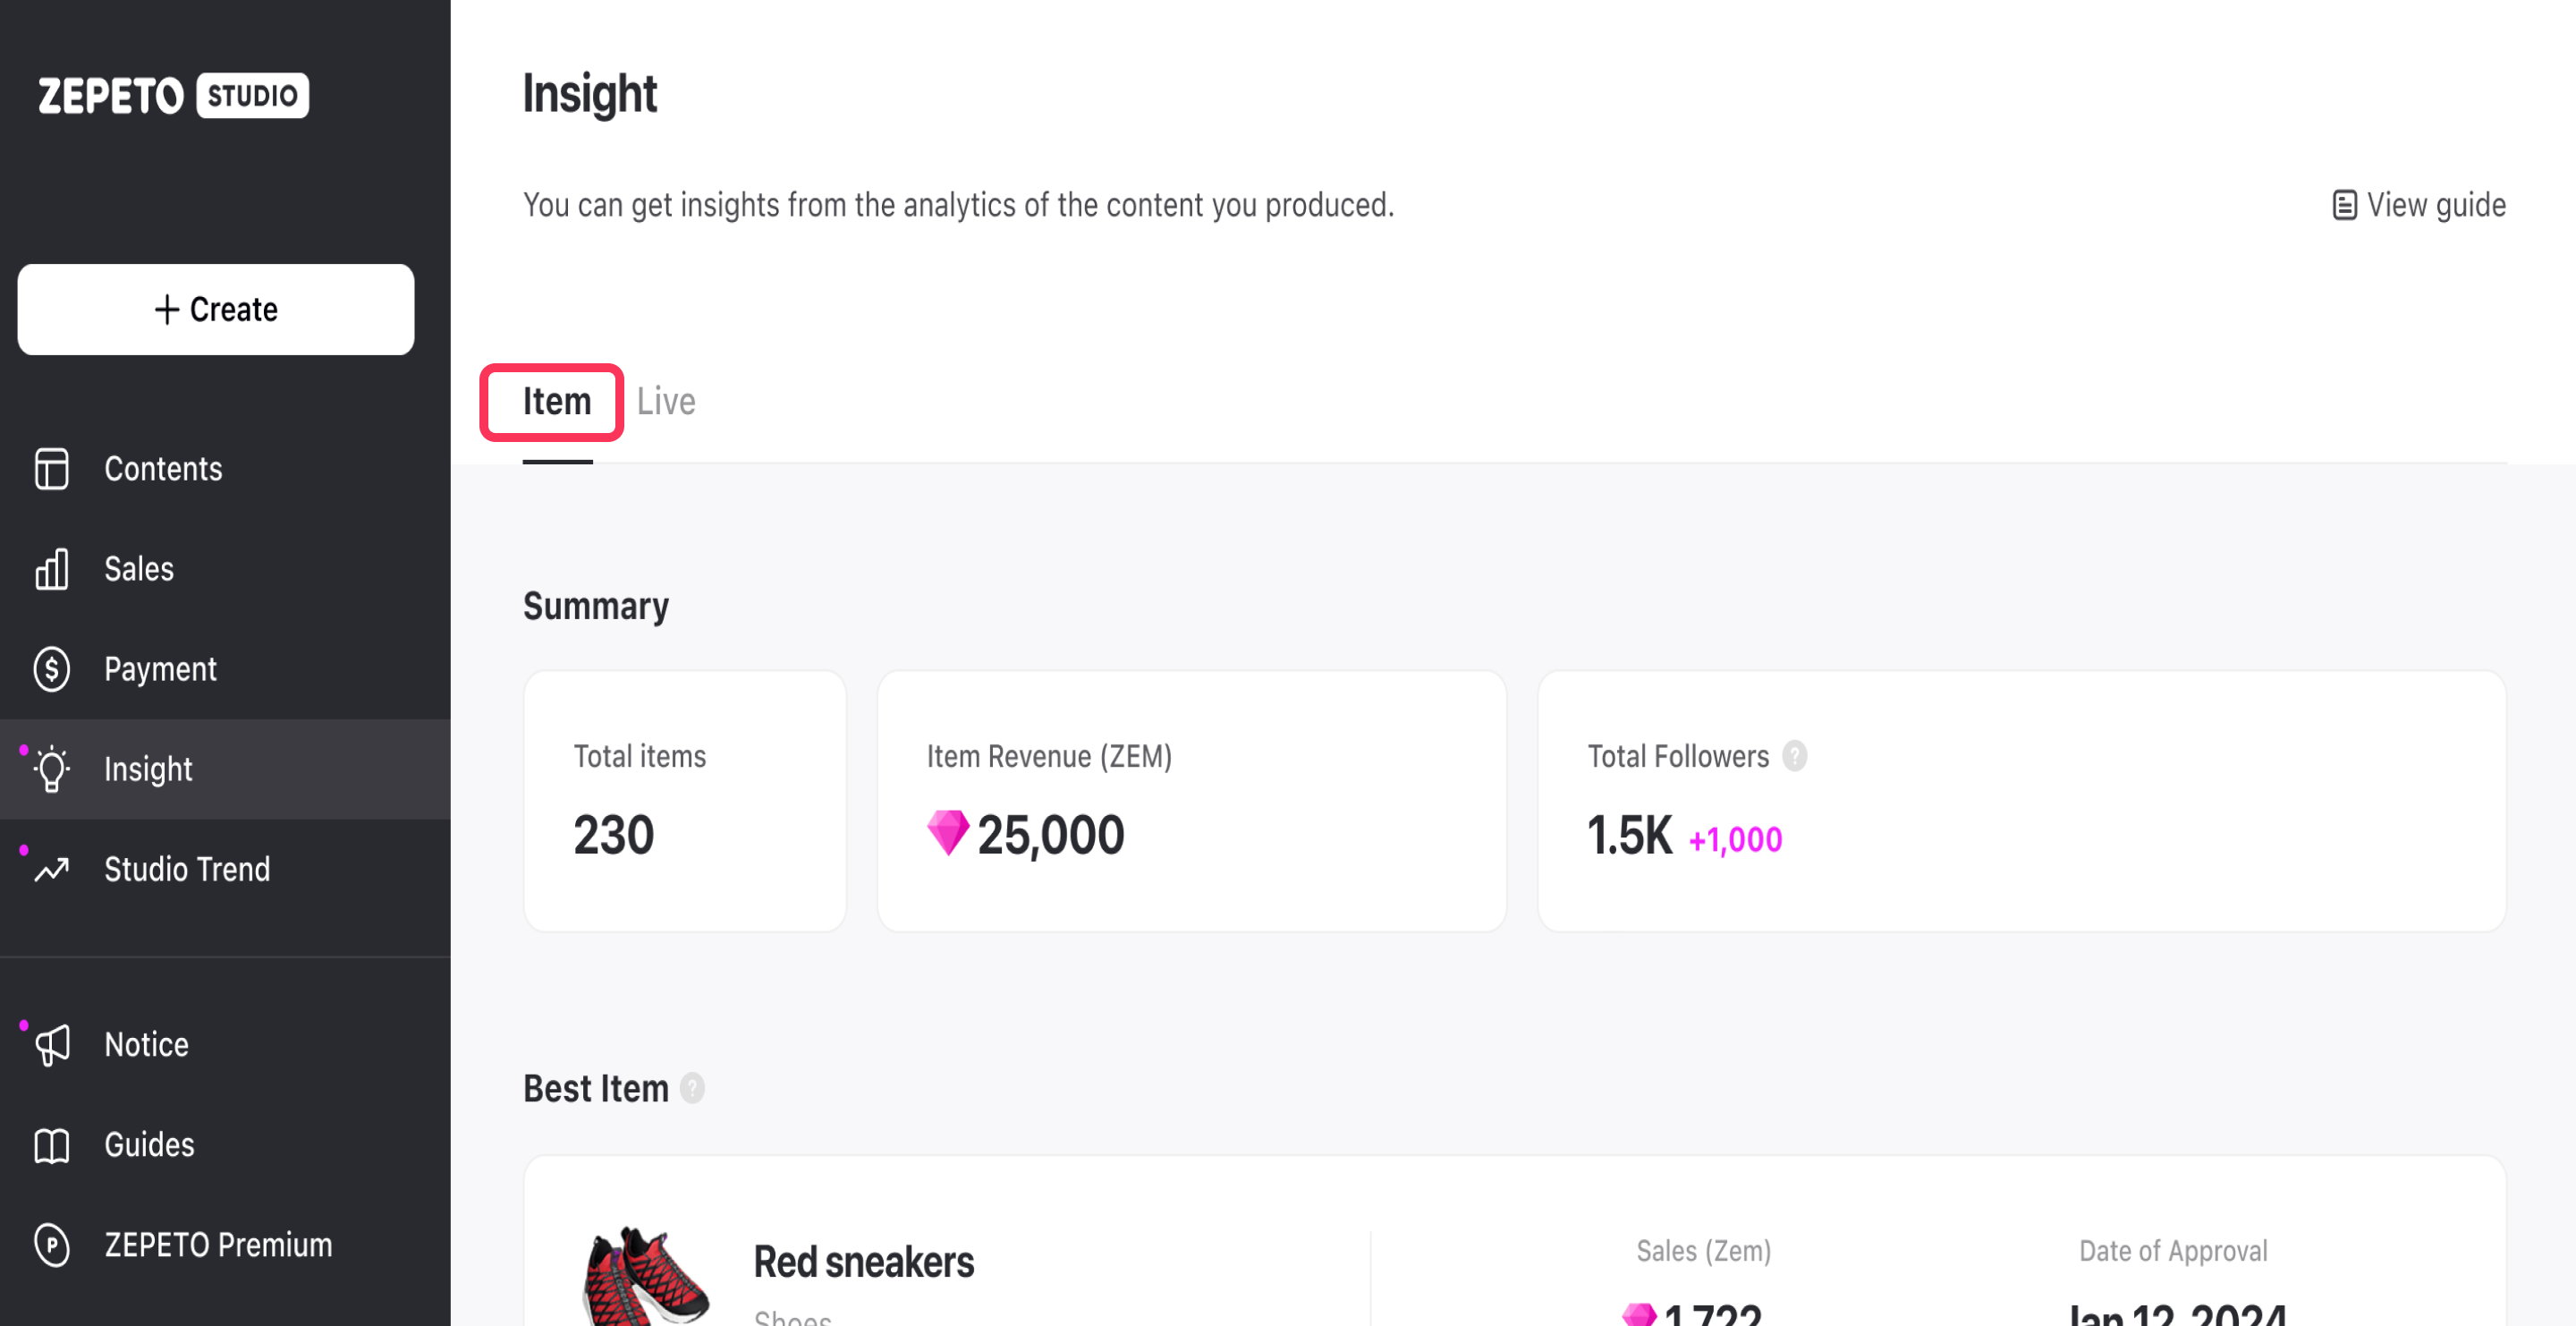
Insight > Item
You can view metrics for all items that are selling.
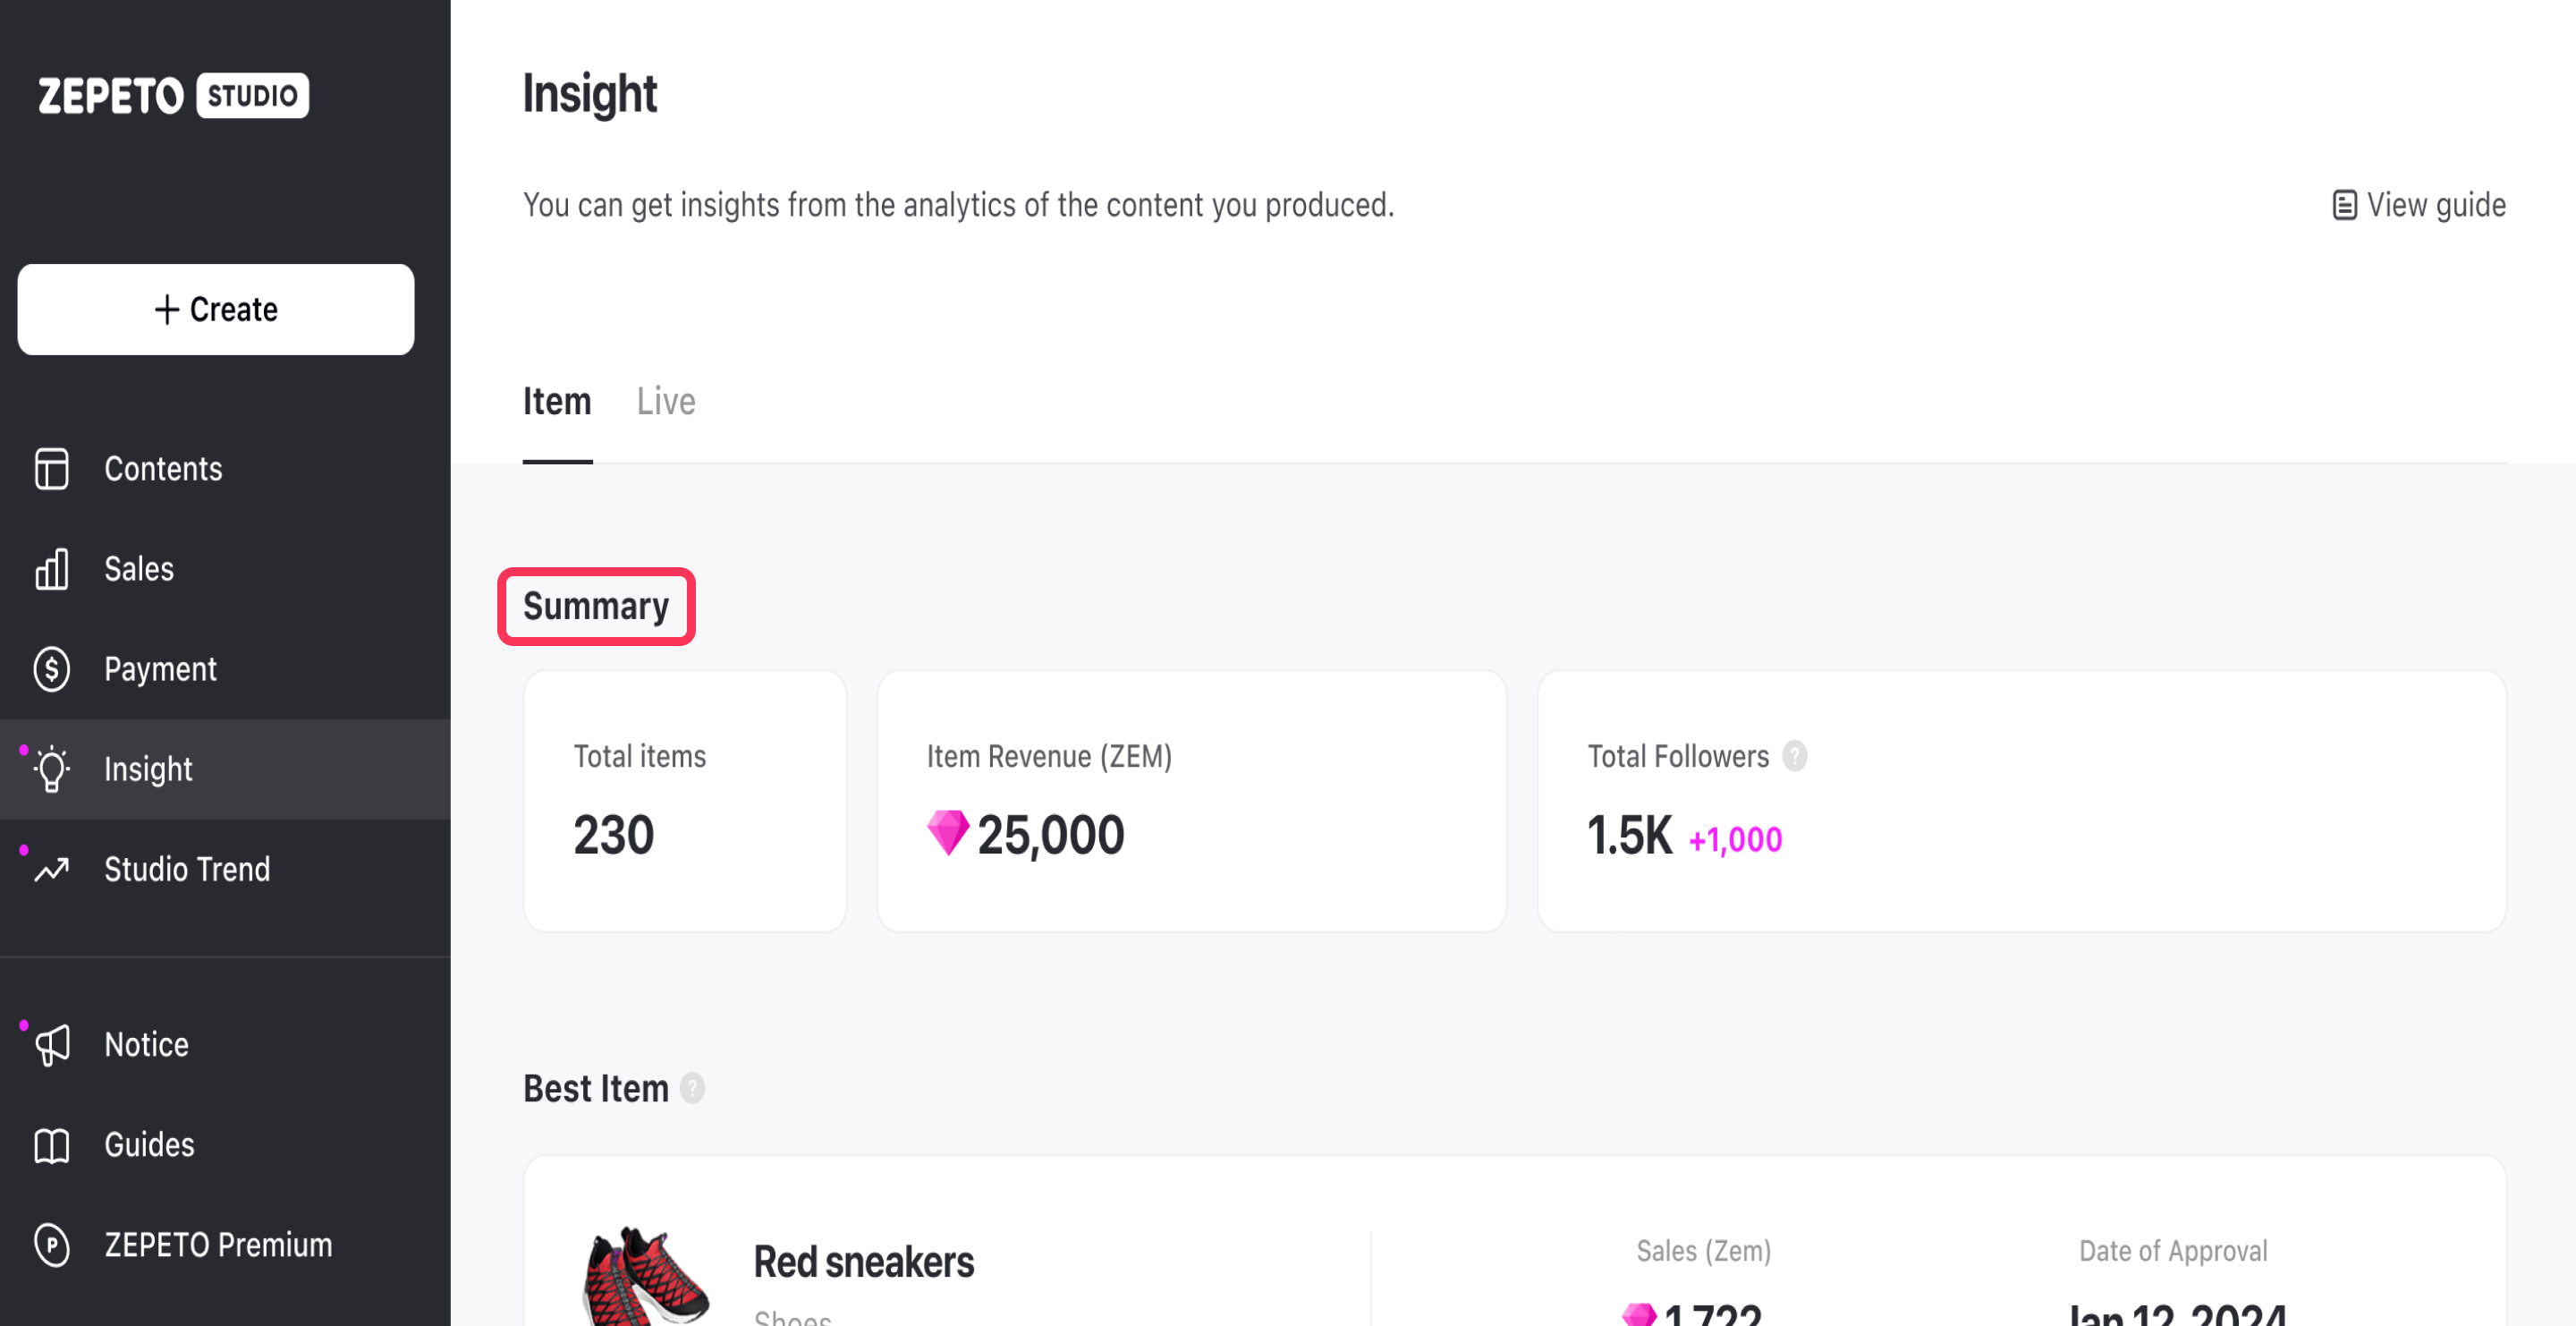
Summary
- Total Item : The total number of items currently on sale
- Total Revenue : Total revenue earned from items on sale (in ZEM)
- Top Category : The category of your items that are selling the most.
- Total Followers: Your Number of Followers
- ️All data are based on the time of viewing, Total Followers is aggregated weekly since January 2024, and all other data is aggregated daily.
- If you can't check your follower information within the period you're viewing, your follower information may not be linked to ZEPETO Studio. Please use the ZEPETO app to check your follower information.
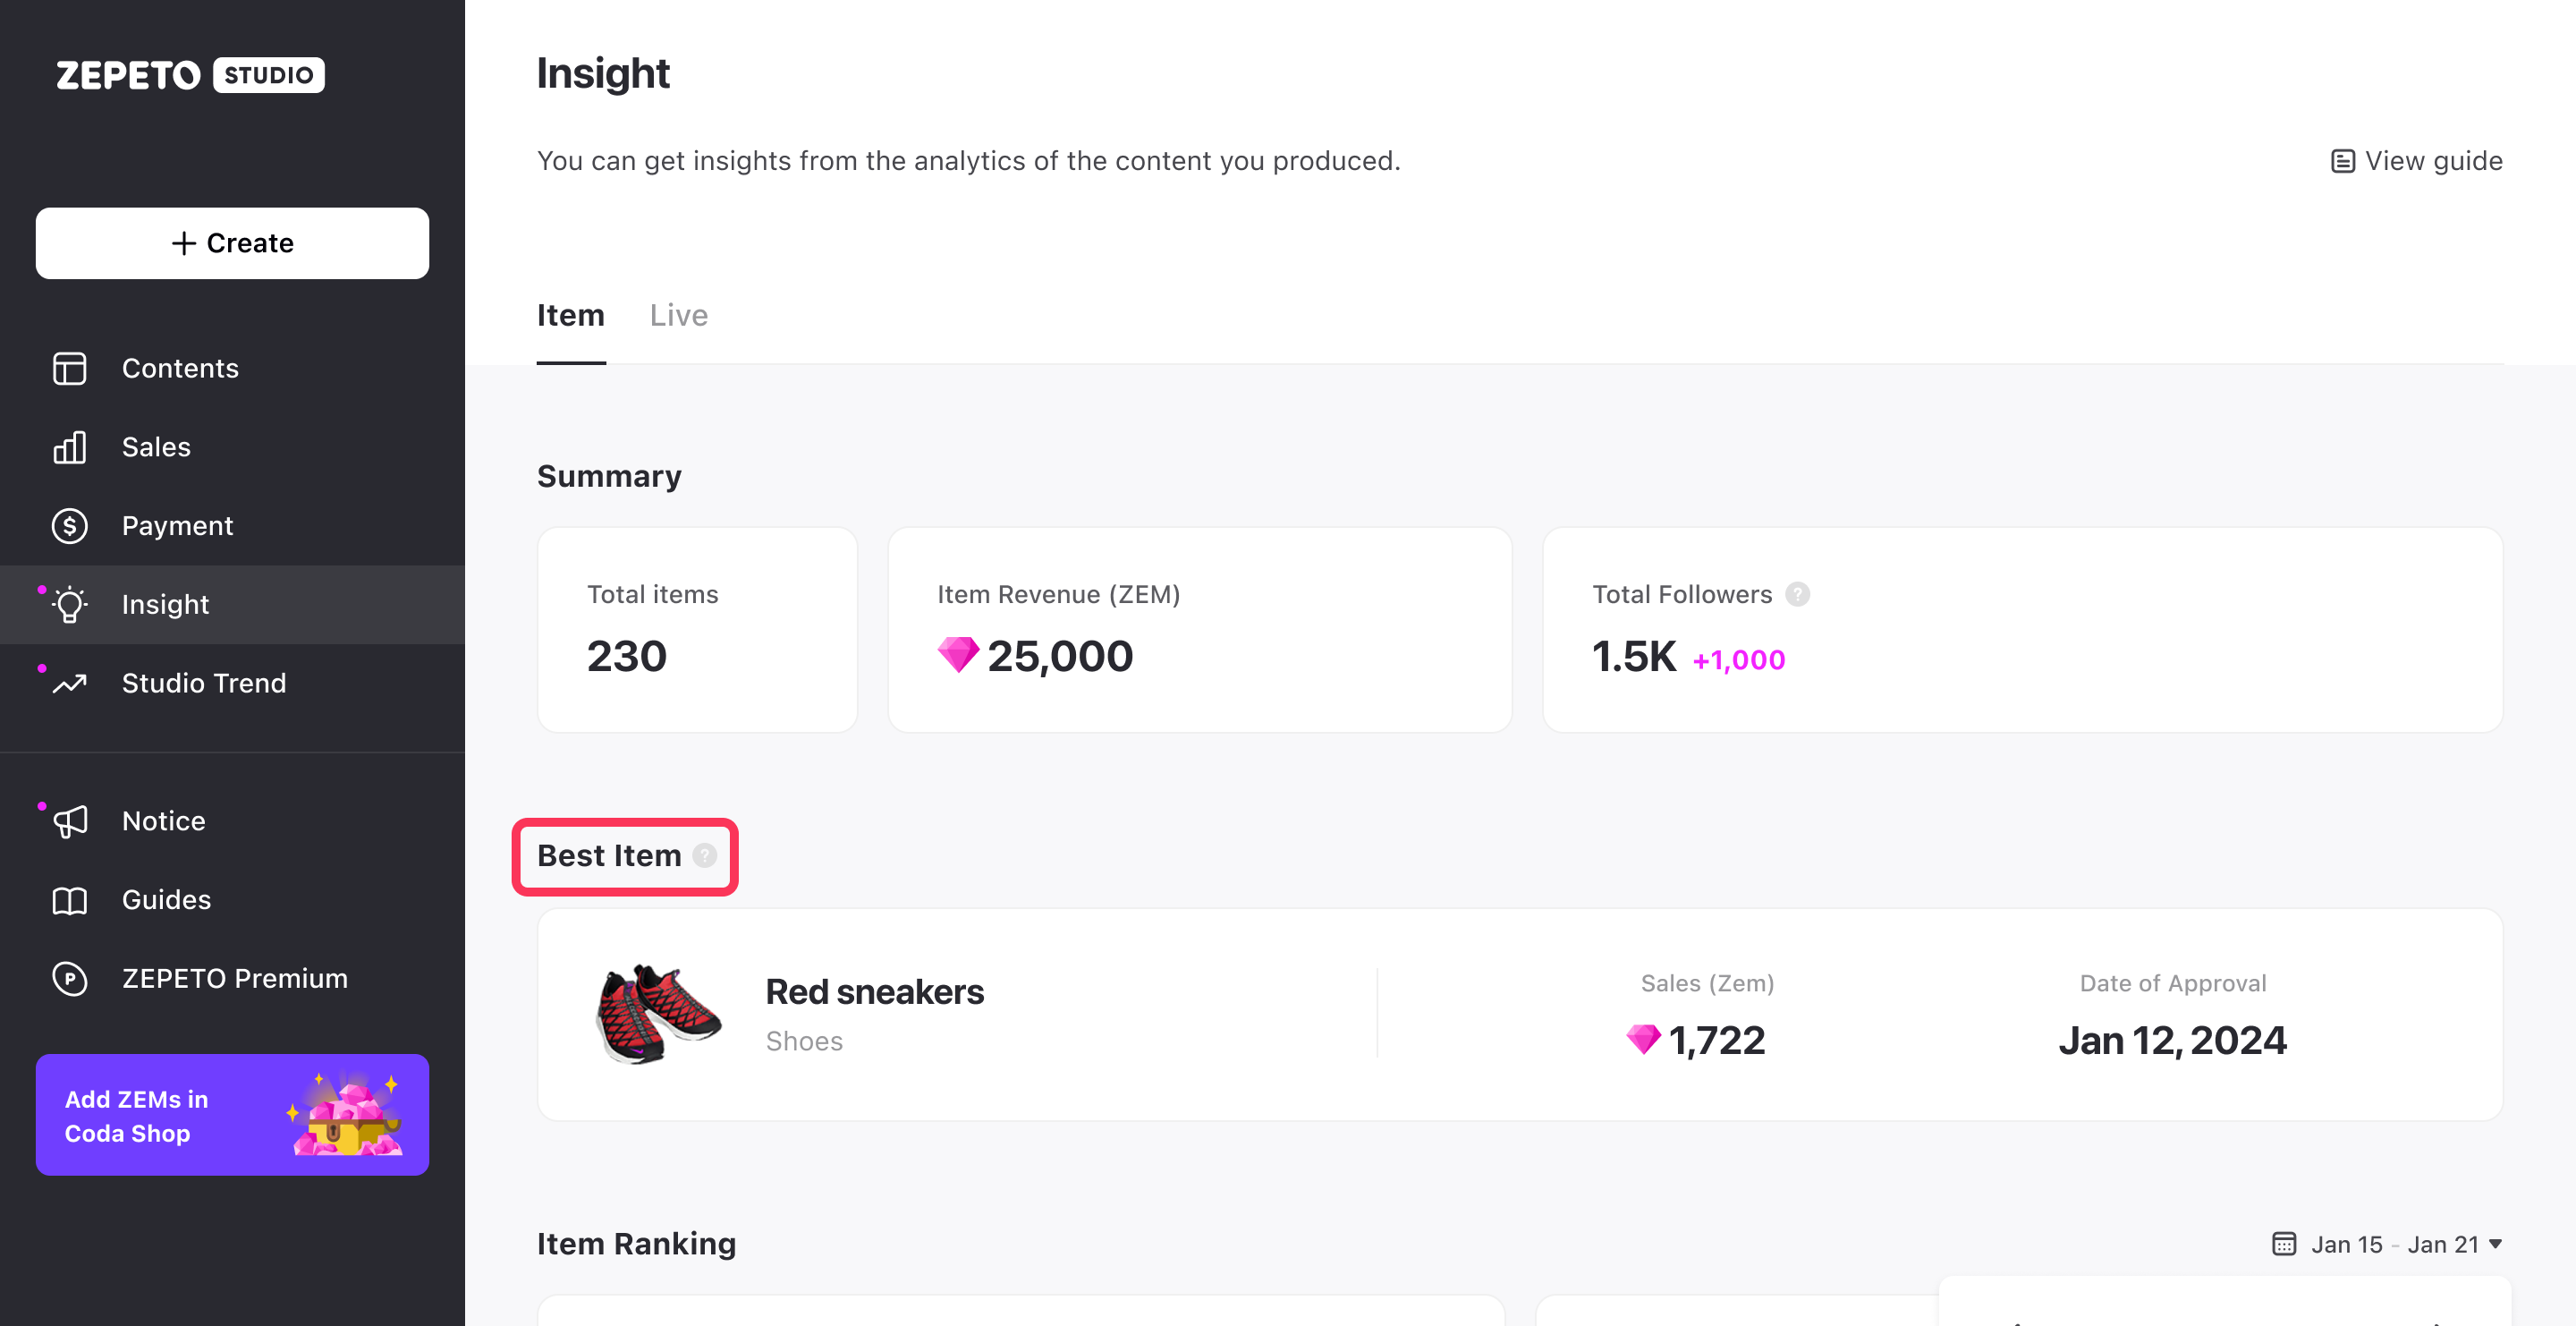
Best Item
Shows your best items with the highest sales at the time of viewing.
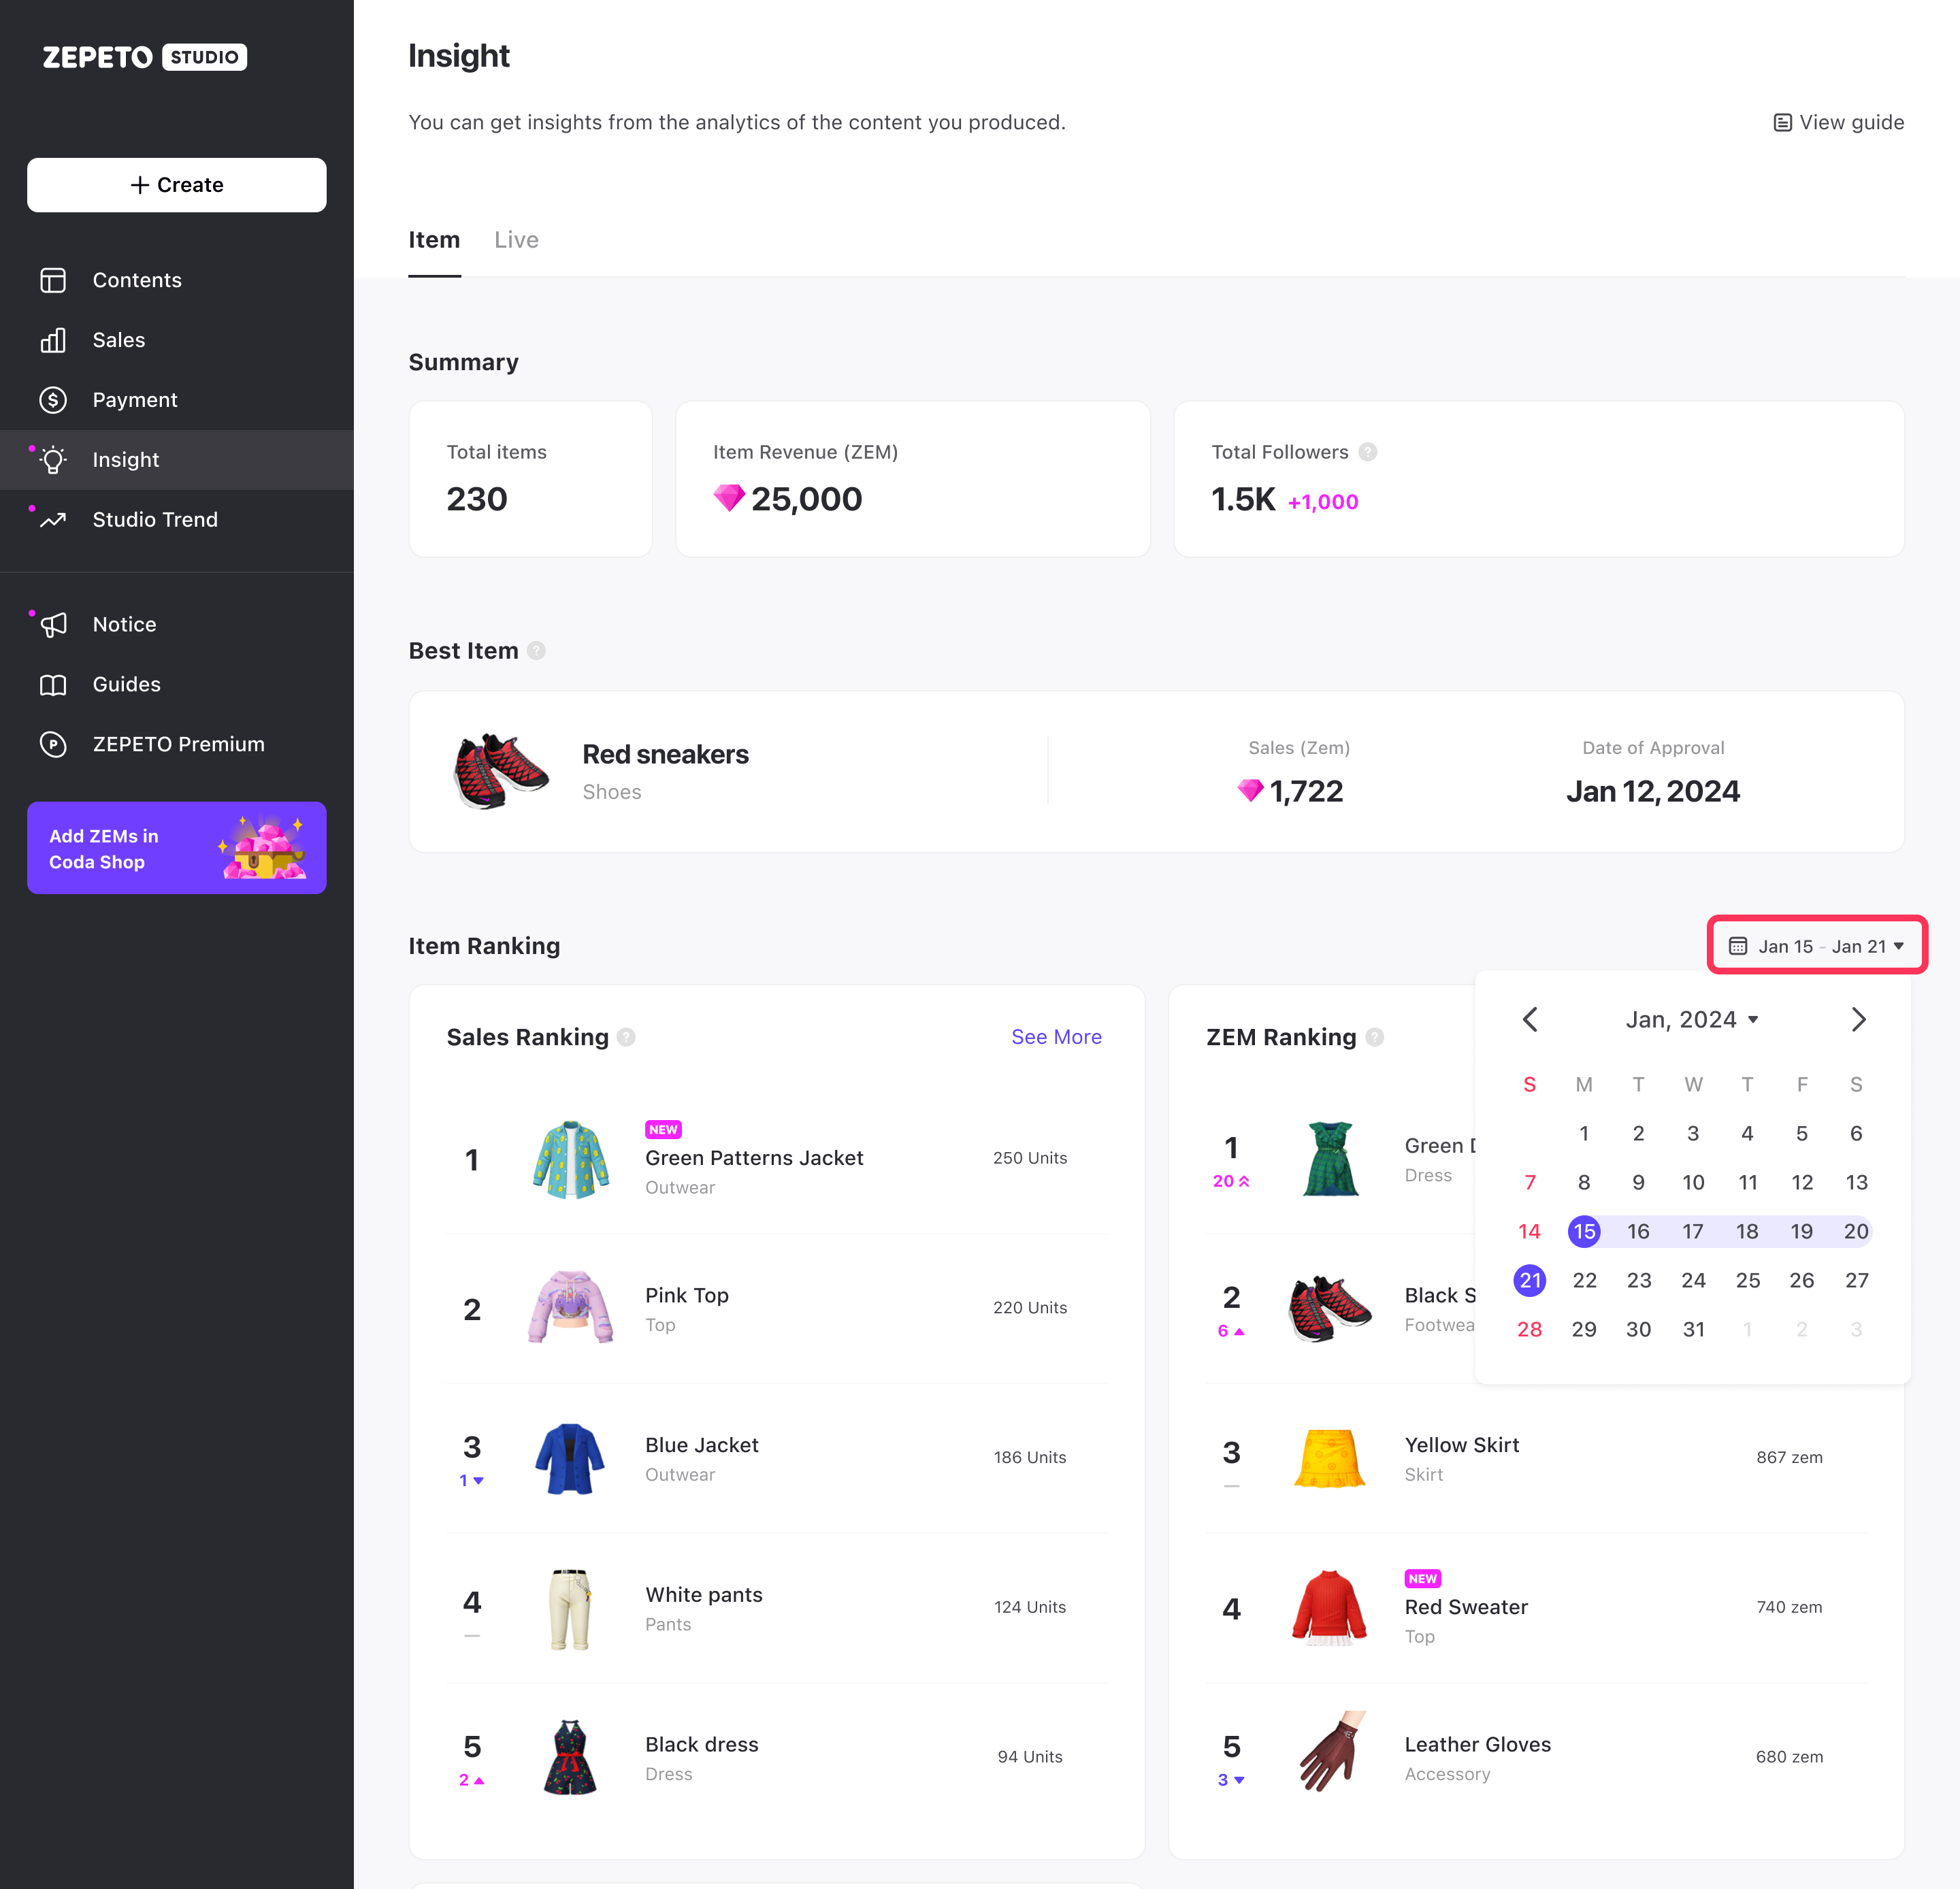
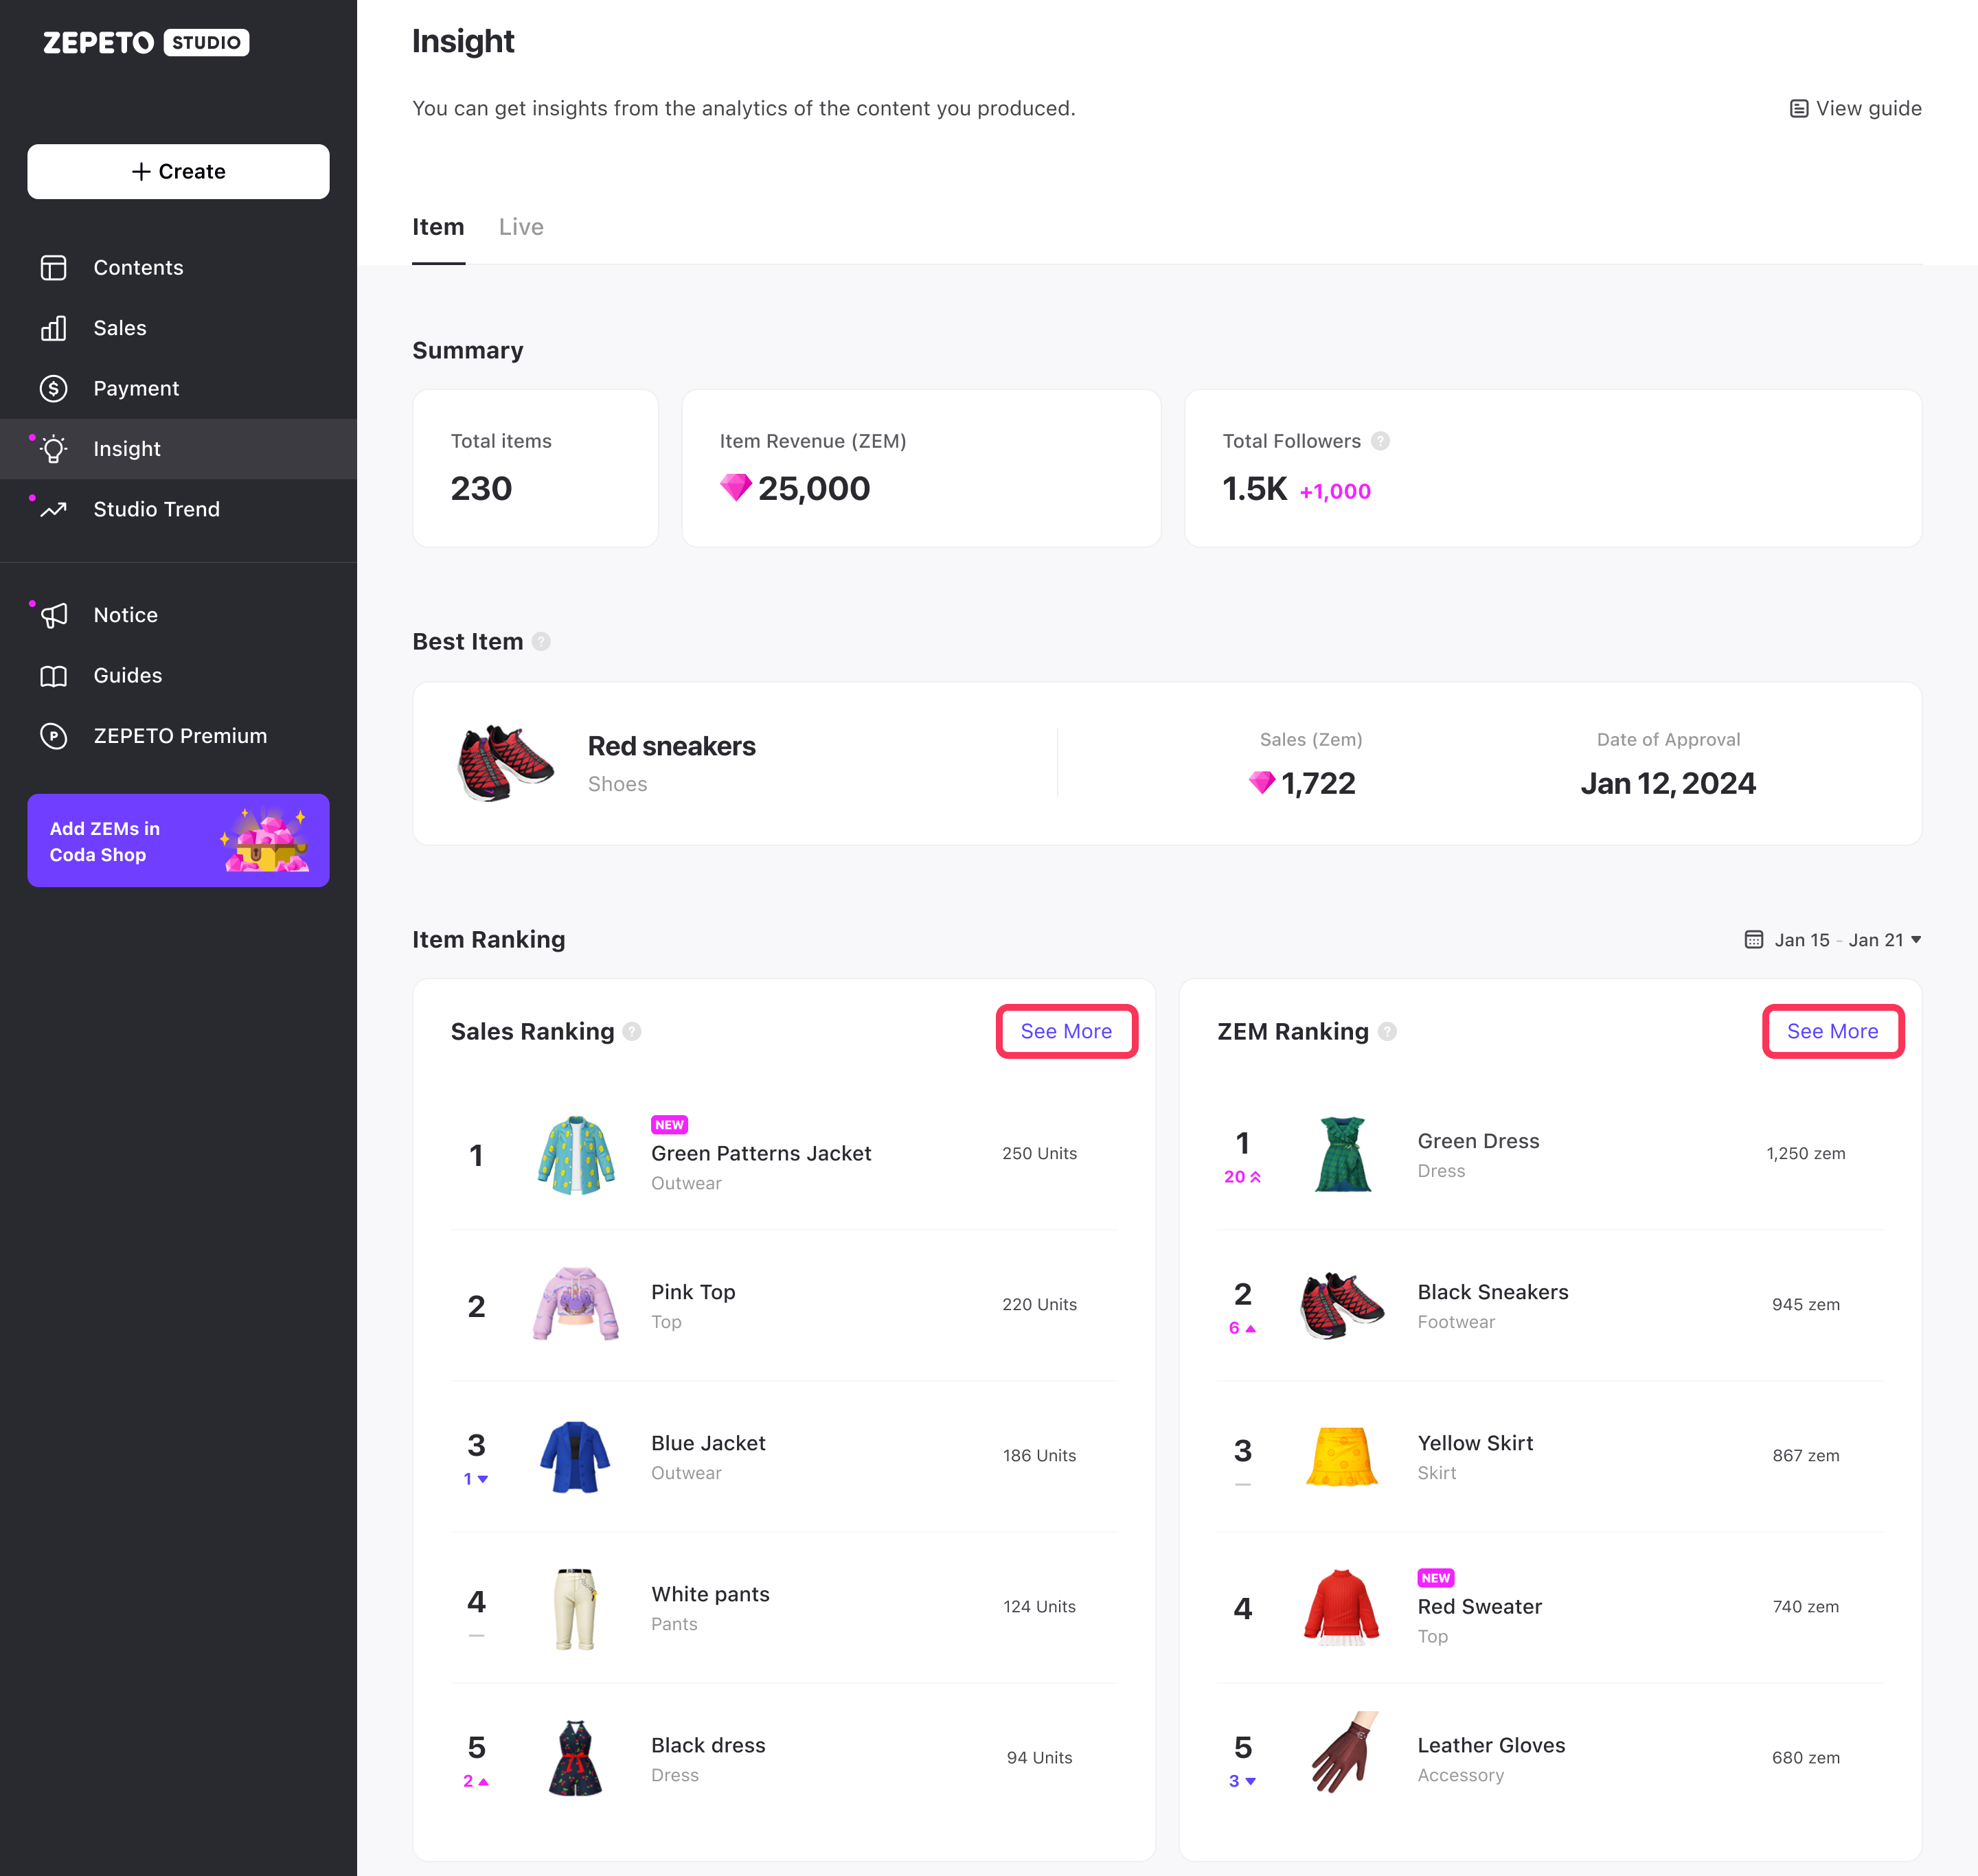
Item Ranking
- Sales Ranking : Items with the highest sales volume on a weekly basis (Mon-Sun)
- ZEM ranking: Items with the most sales revenue by week (Mon-Sun)
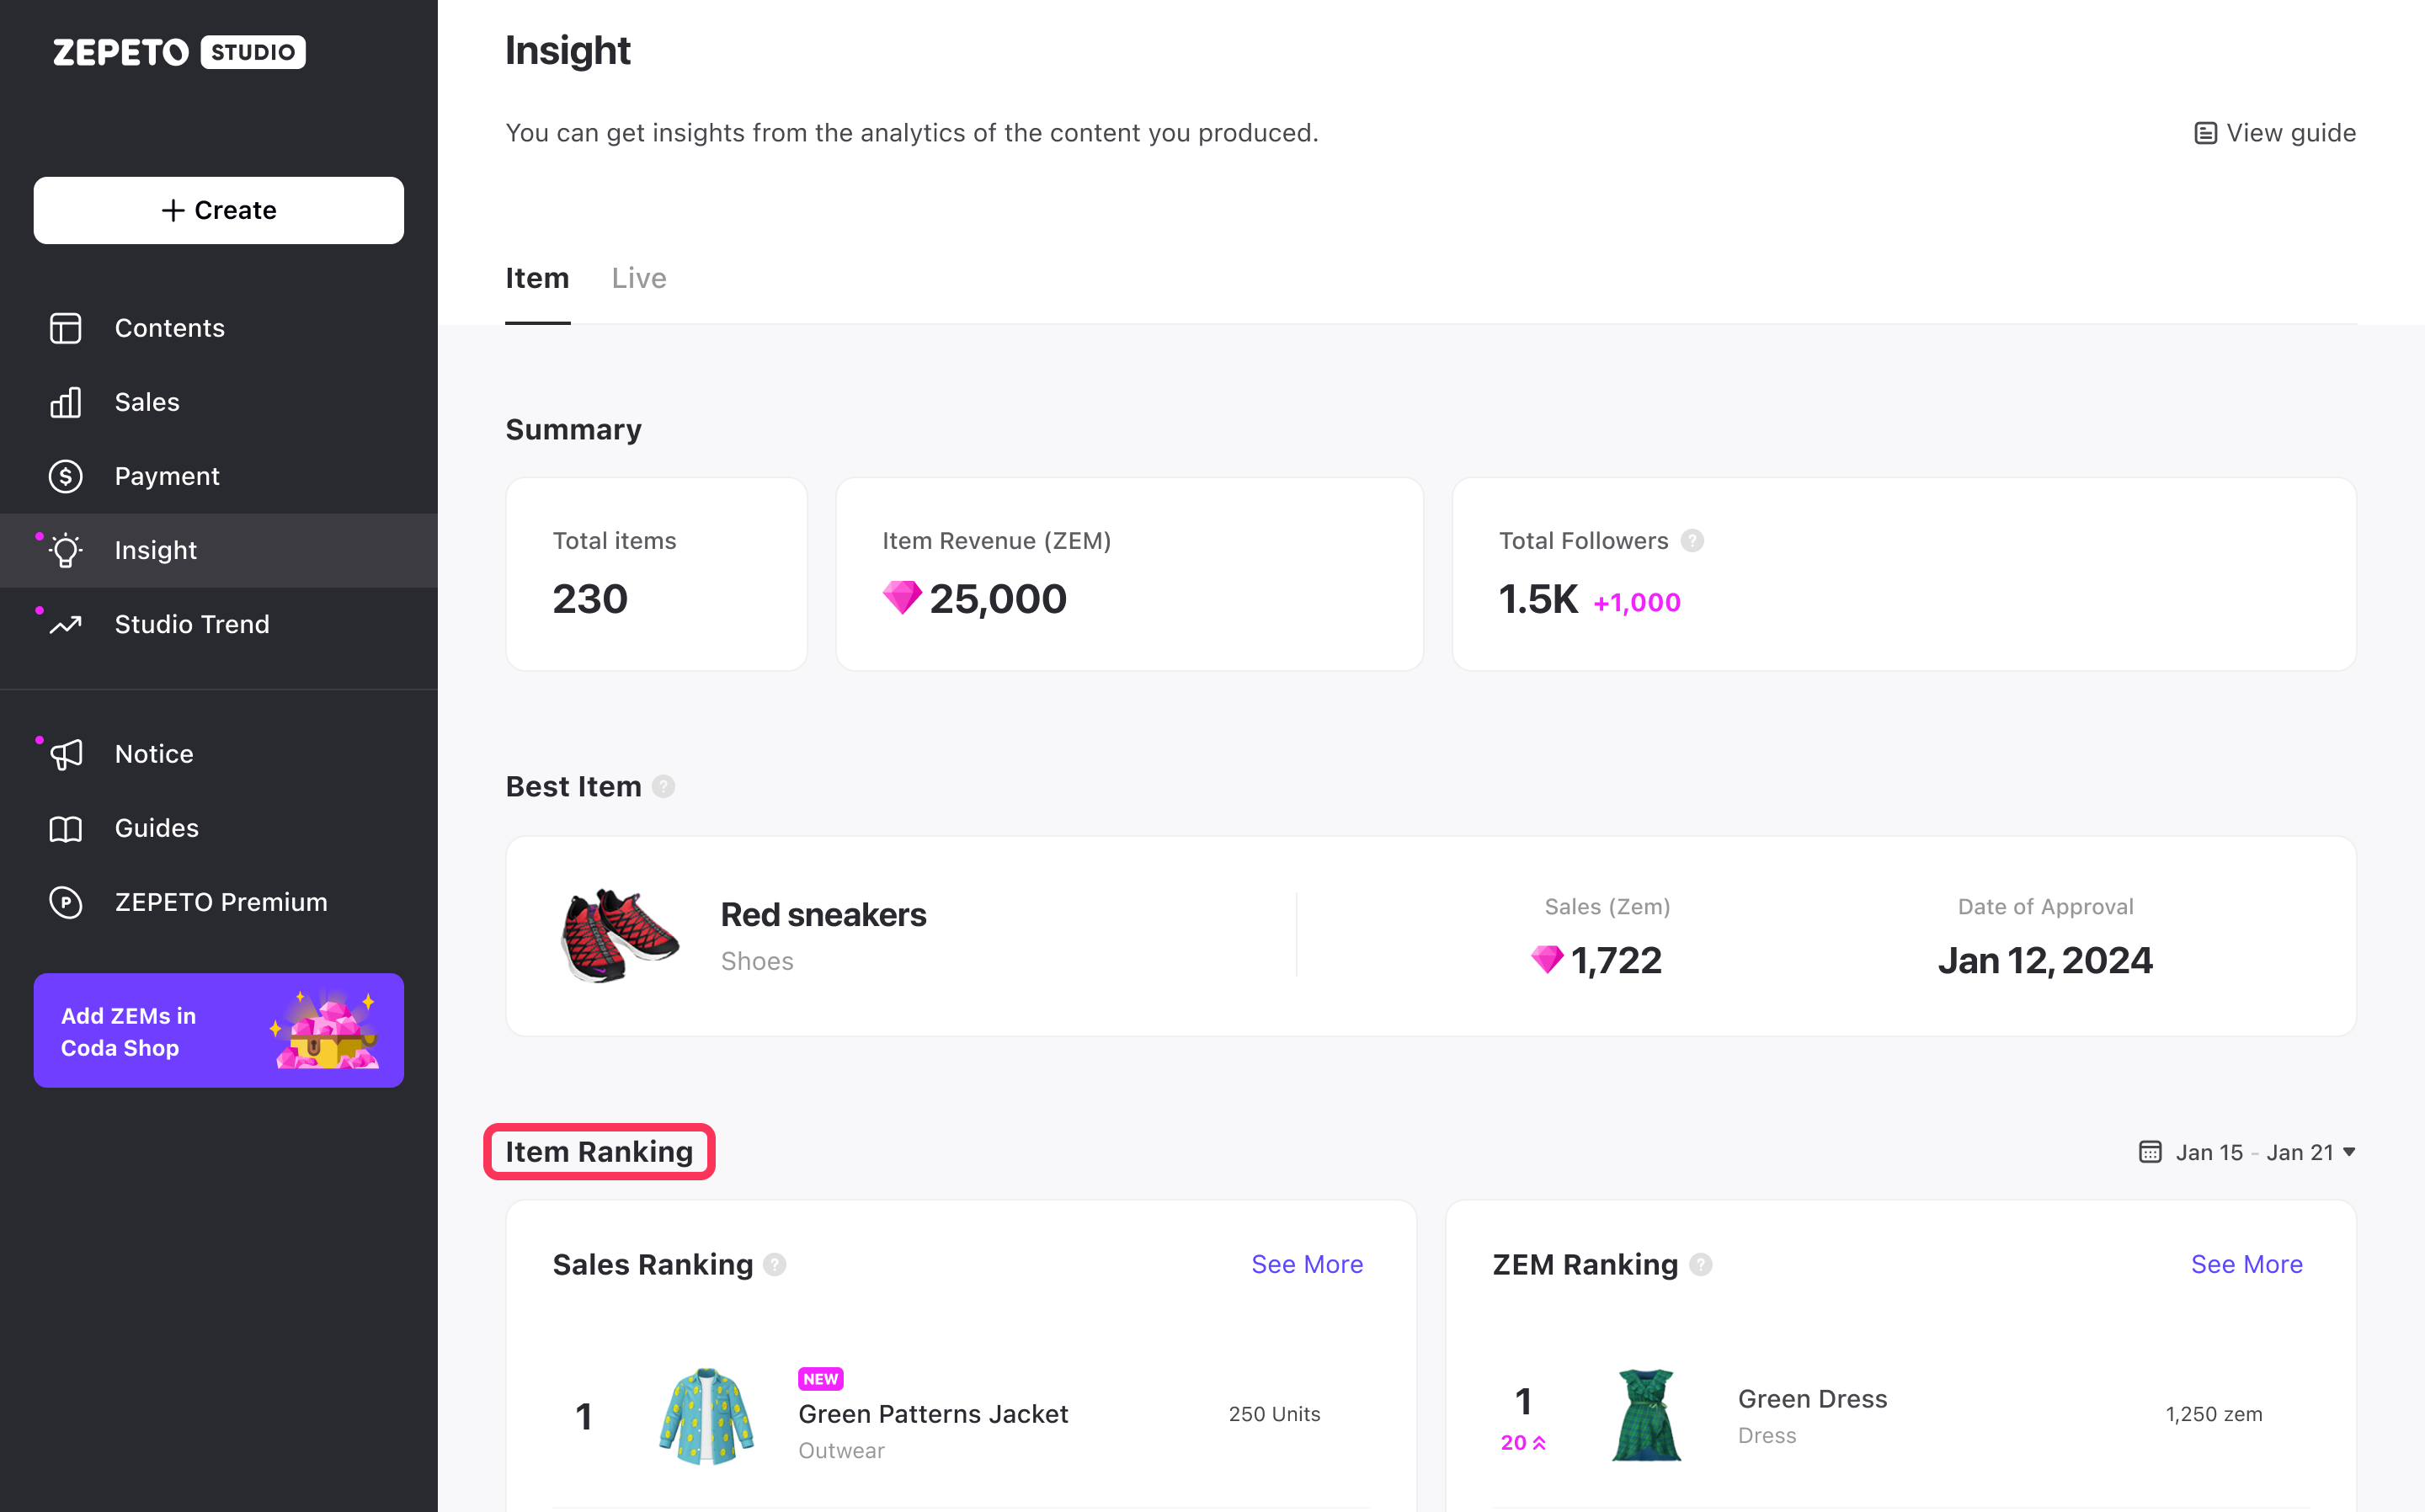
If you're selling a lot of units but not a lot of sales revenue, then raise your price!
You can set a time period to view your item's ranking.
Warning
The ranking is calculated only for your items.
The ranking will be compared to the previous period's ranking, and will show rising, rising fast, new, and falling in the same time period as the ranking based on the conditions you set. However, weekly rankings can only be viewed on a monthly to daily basis.
ex) If you set the period to 23.01.15~23.01.21, you can compare it with the data from 23.01.08~23.01.14, which is one week ago.
- Surge : Ranking 20 or more spots from the previous week
- New : An item that wasn't in the rankings last week appears in the rankings.
If you have a lot of items that have sold, then you can view up to the 20th position through the See More button.
Refunds that occurred after the time of the weekly aggregation are not included in the ranking aggregation, so if you have received a refund, it may differ from the actual number of units sold/sales. Rankings are available from Jan 2, 2023 data.
The metrics provided on this page may differ from the actual number of sales/sales used for settlement.
Items on Sale
You can see what's on sale, and tap the item's thumbnail to go to the item details page. Tap the More button to go to the item page of the content to see insights about the items on sale.
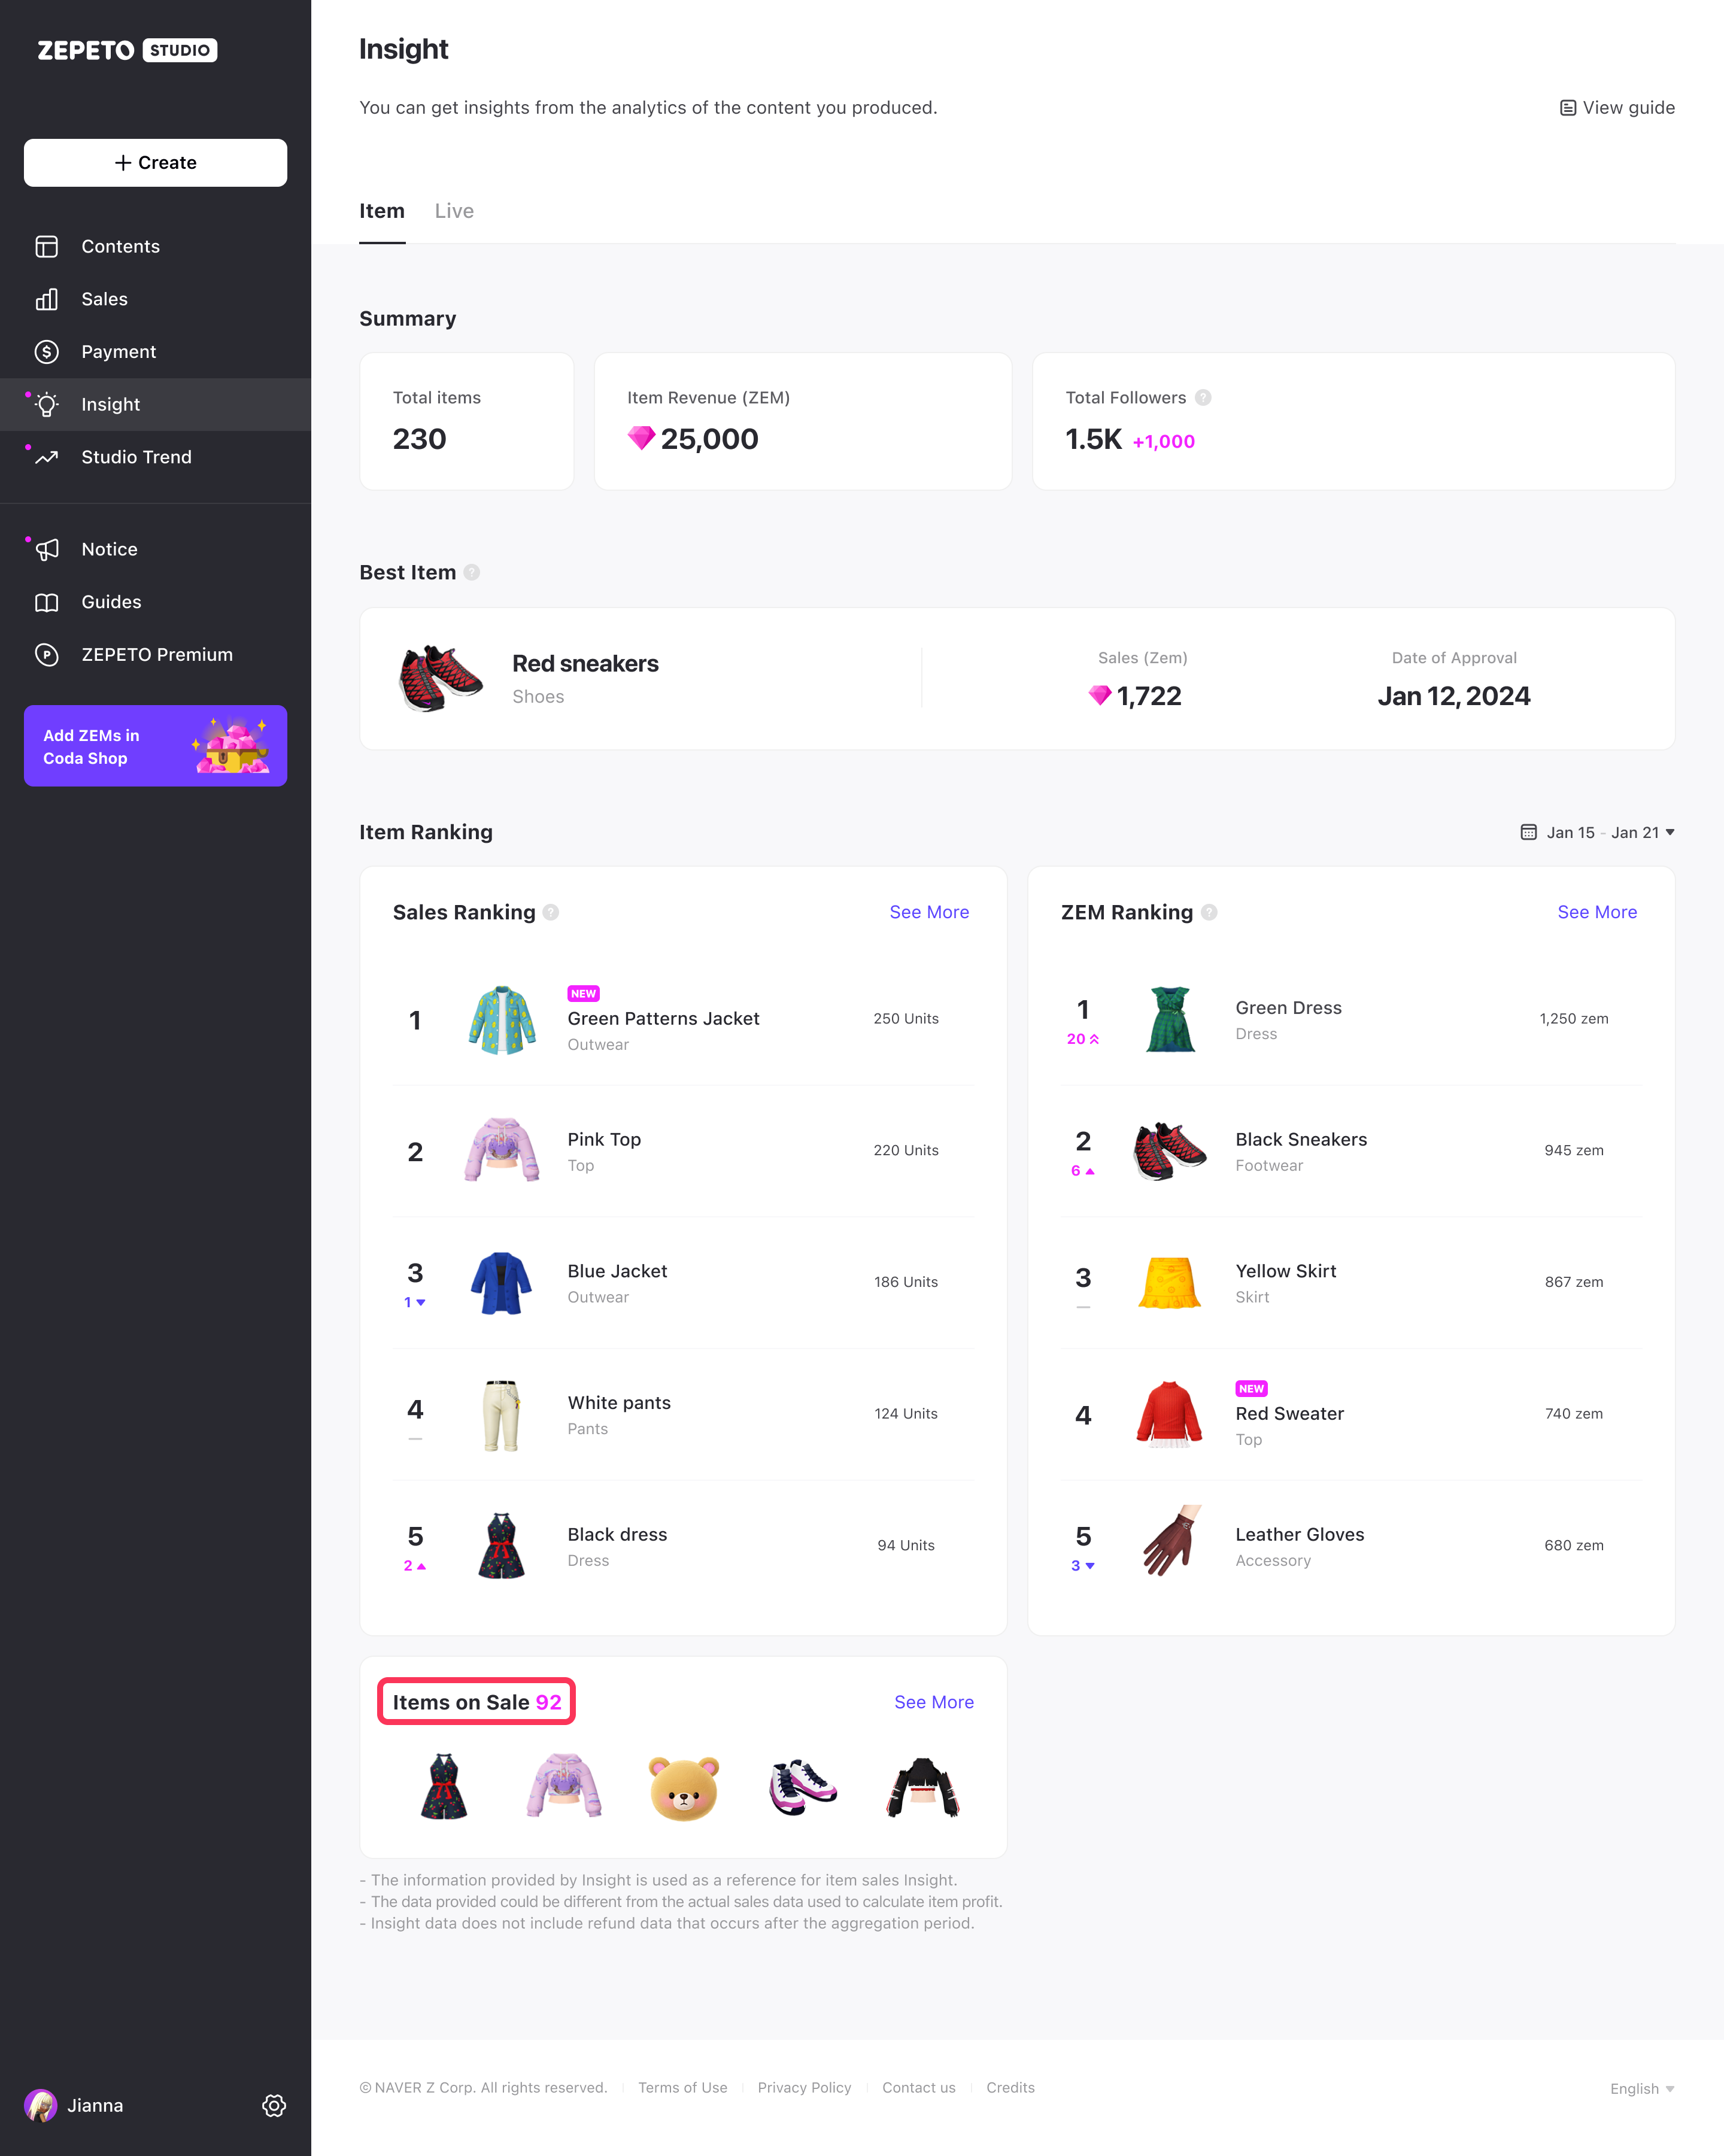
However, you can only see insights for items that are currently on sale.
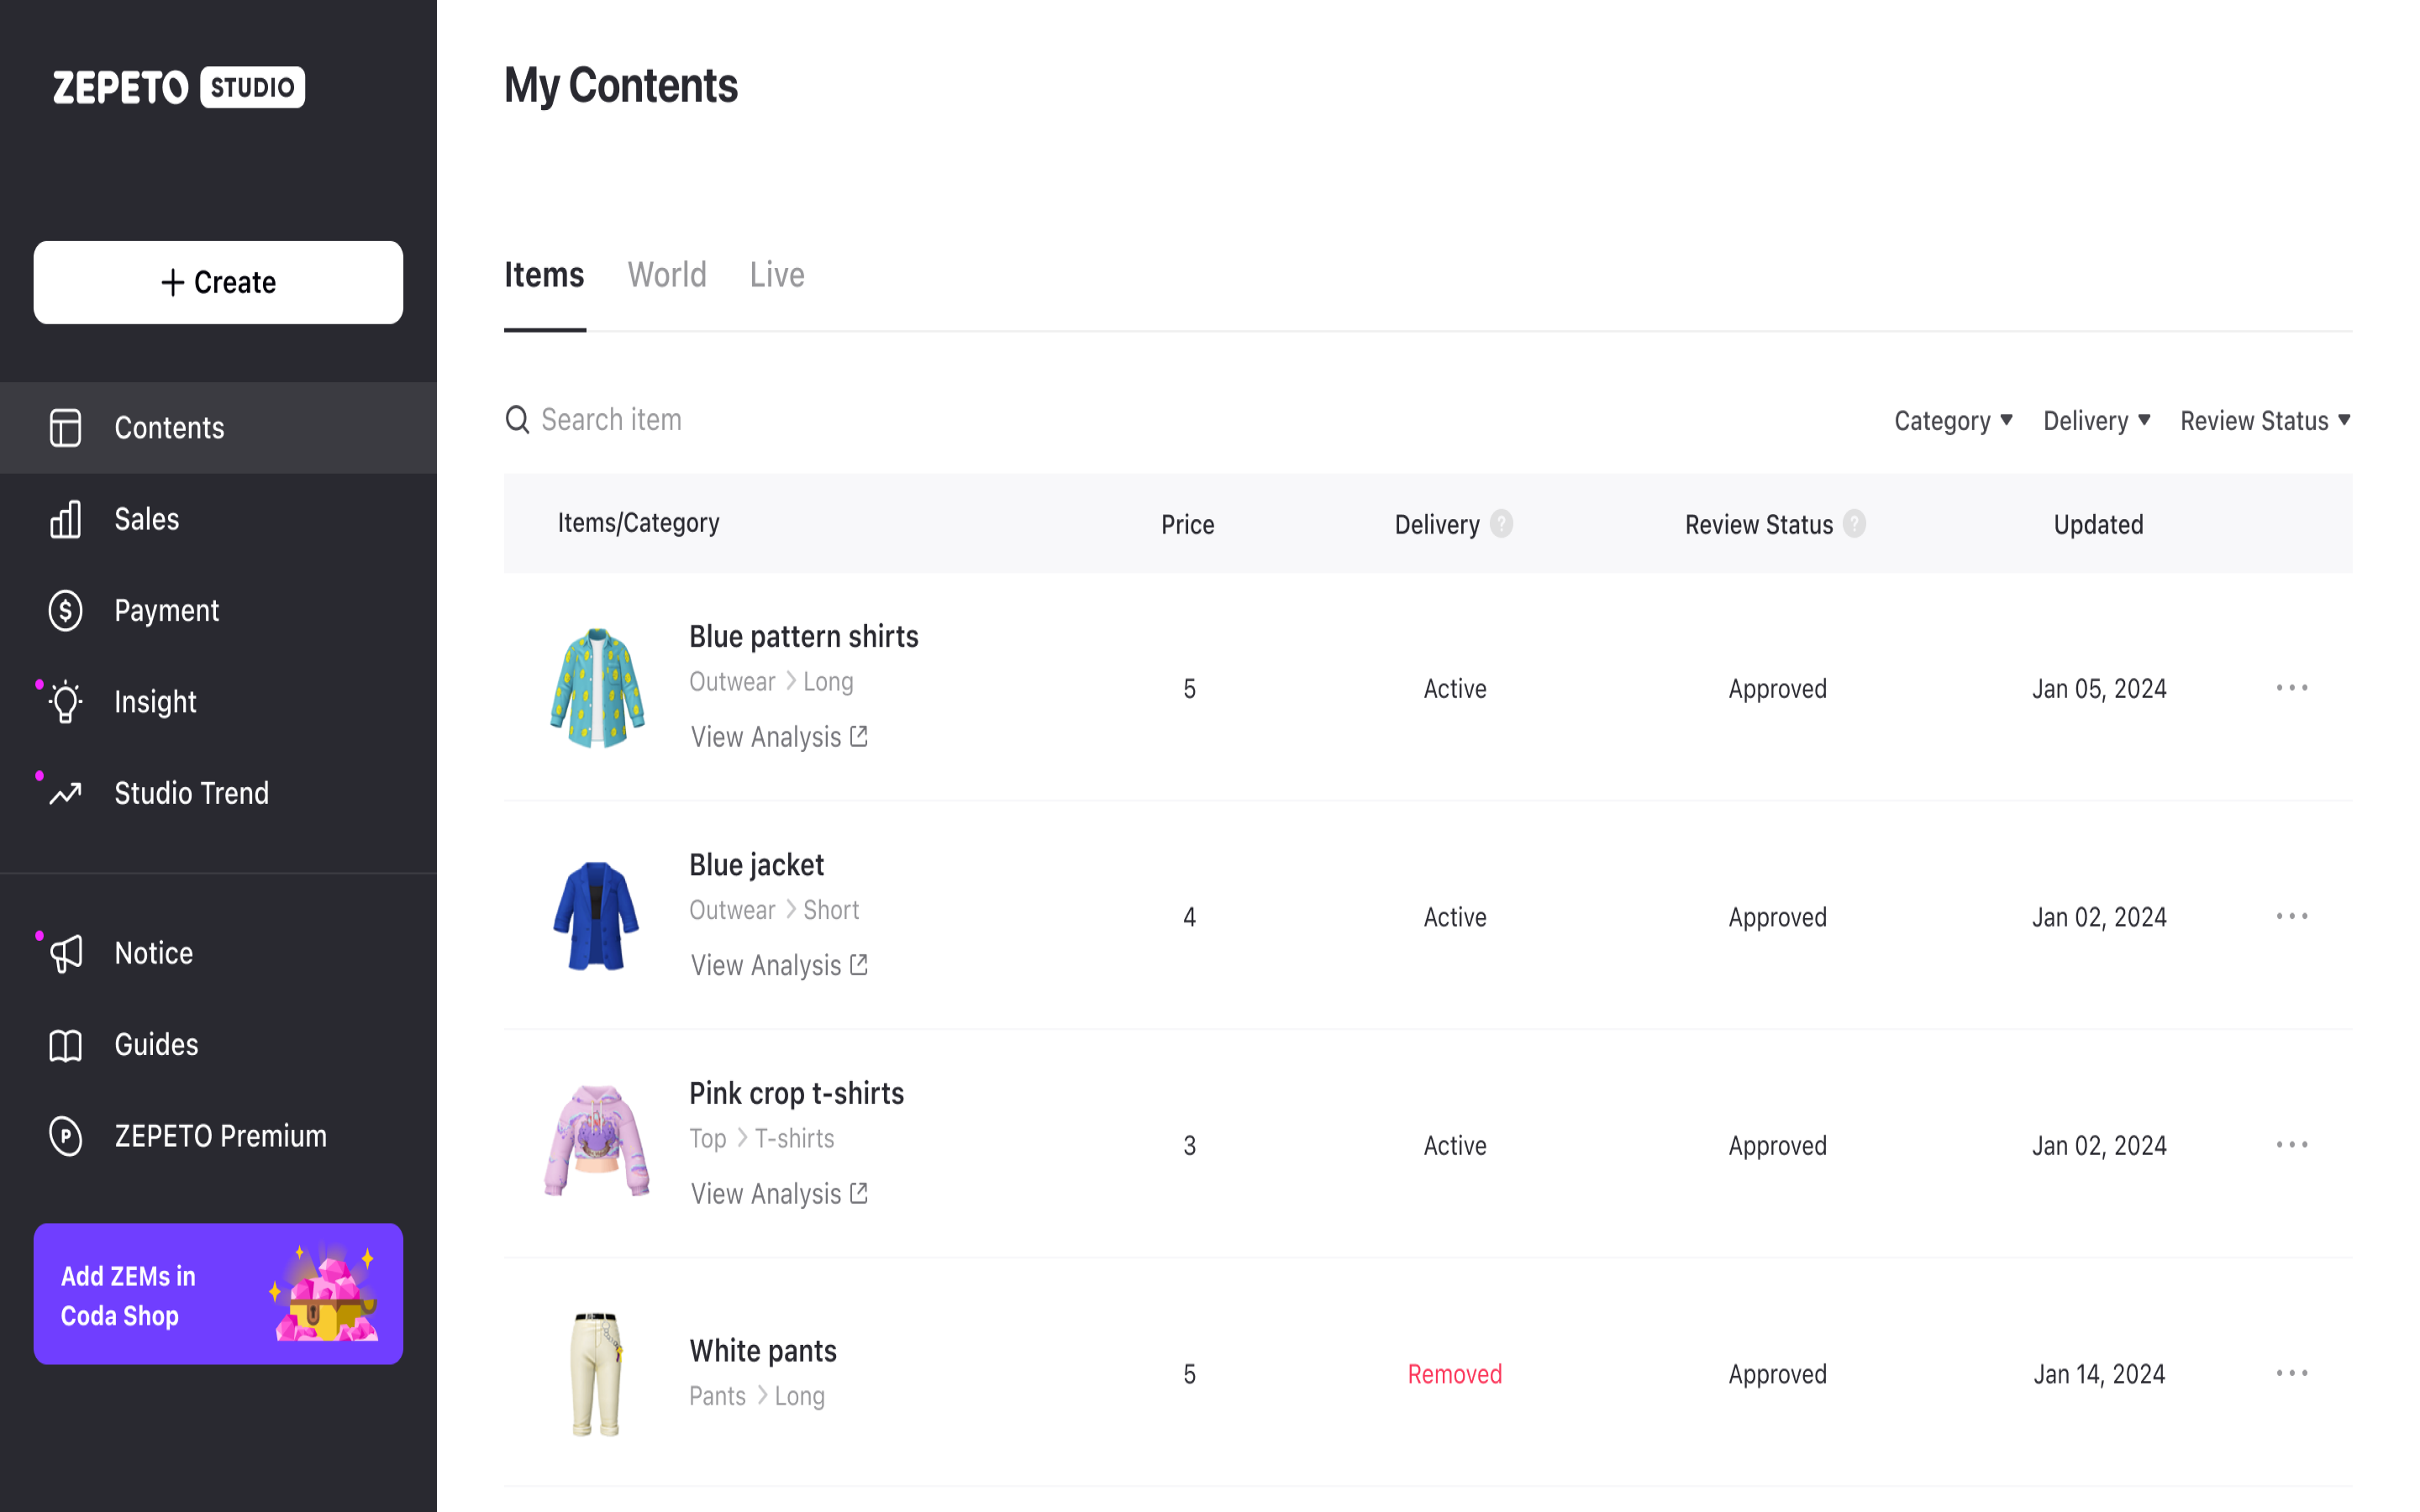
You can also view insights for items on sale directly from Content > Items.
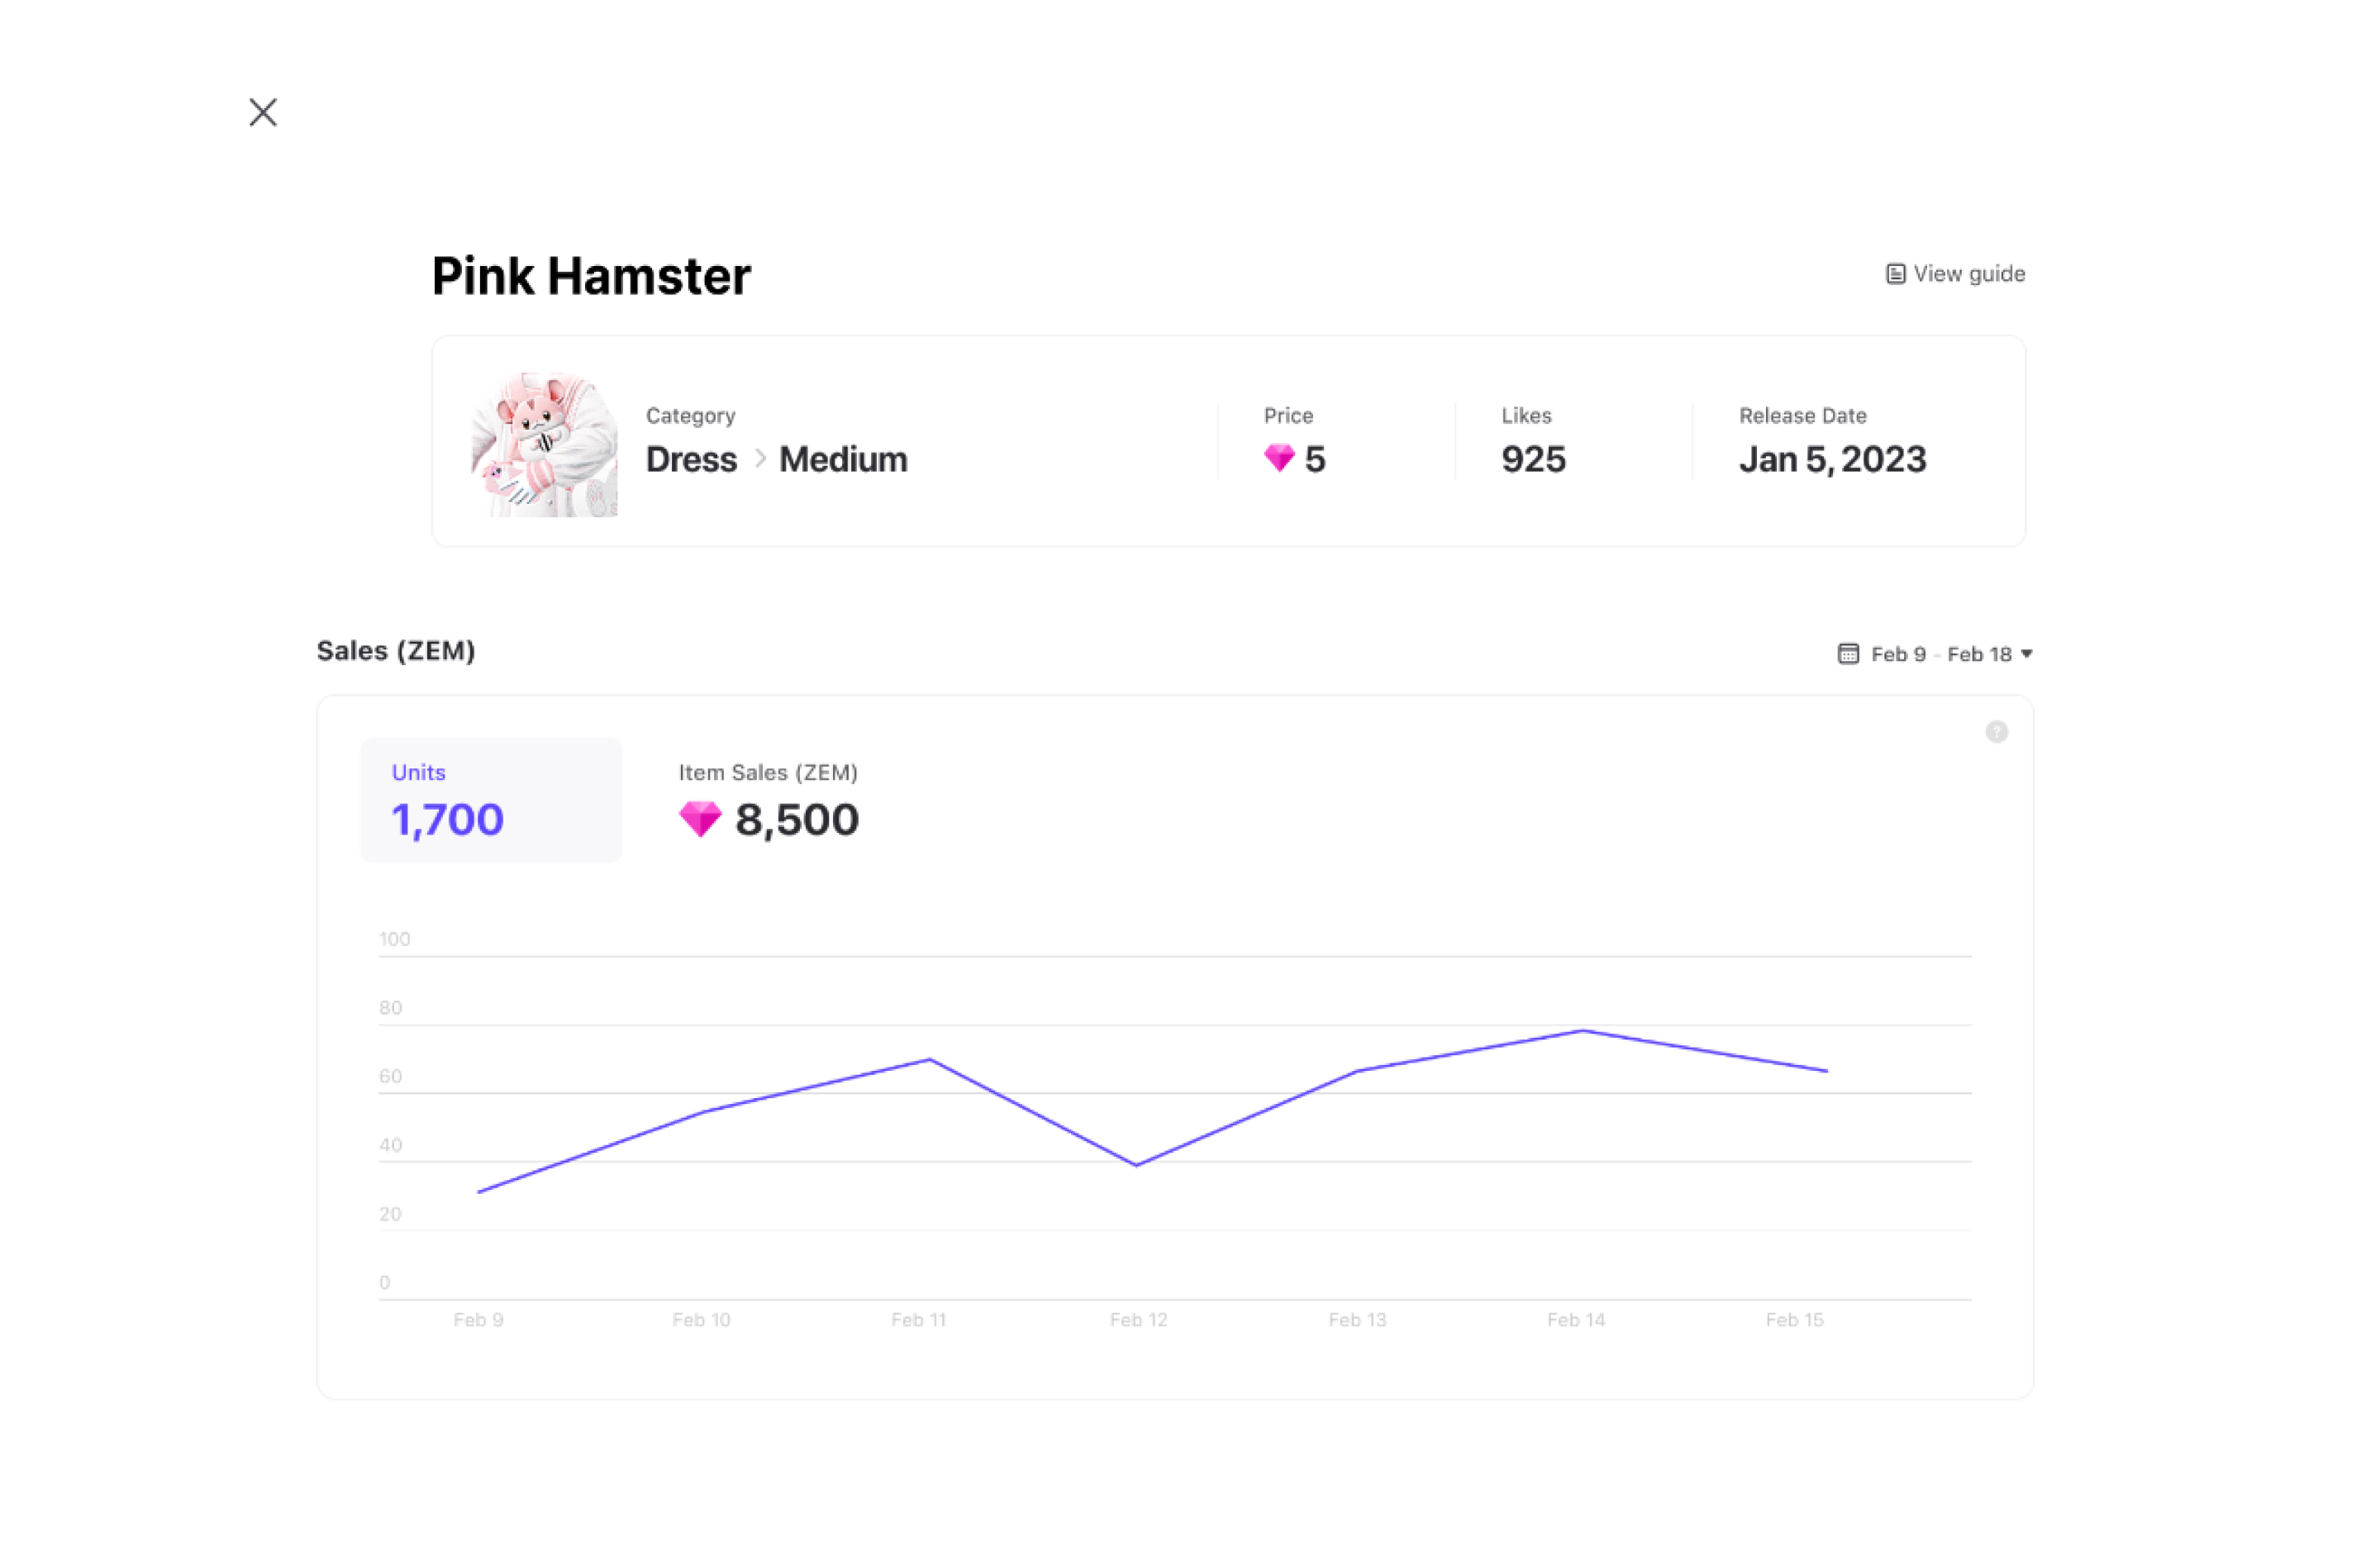
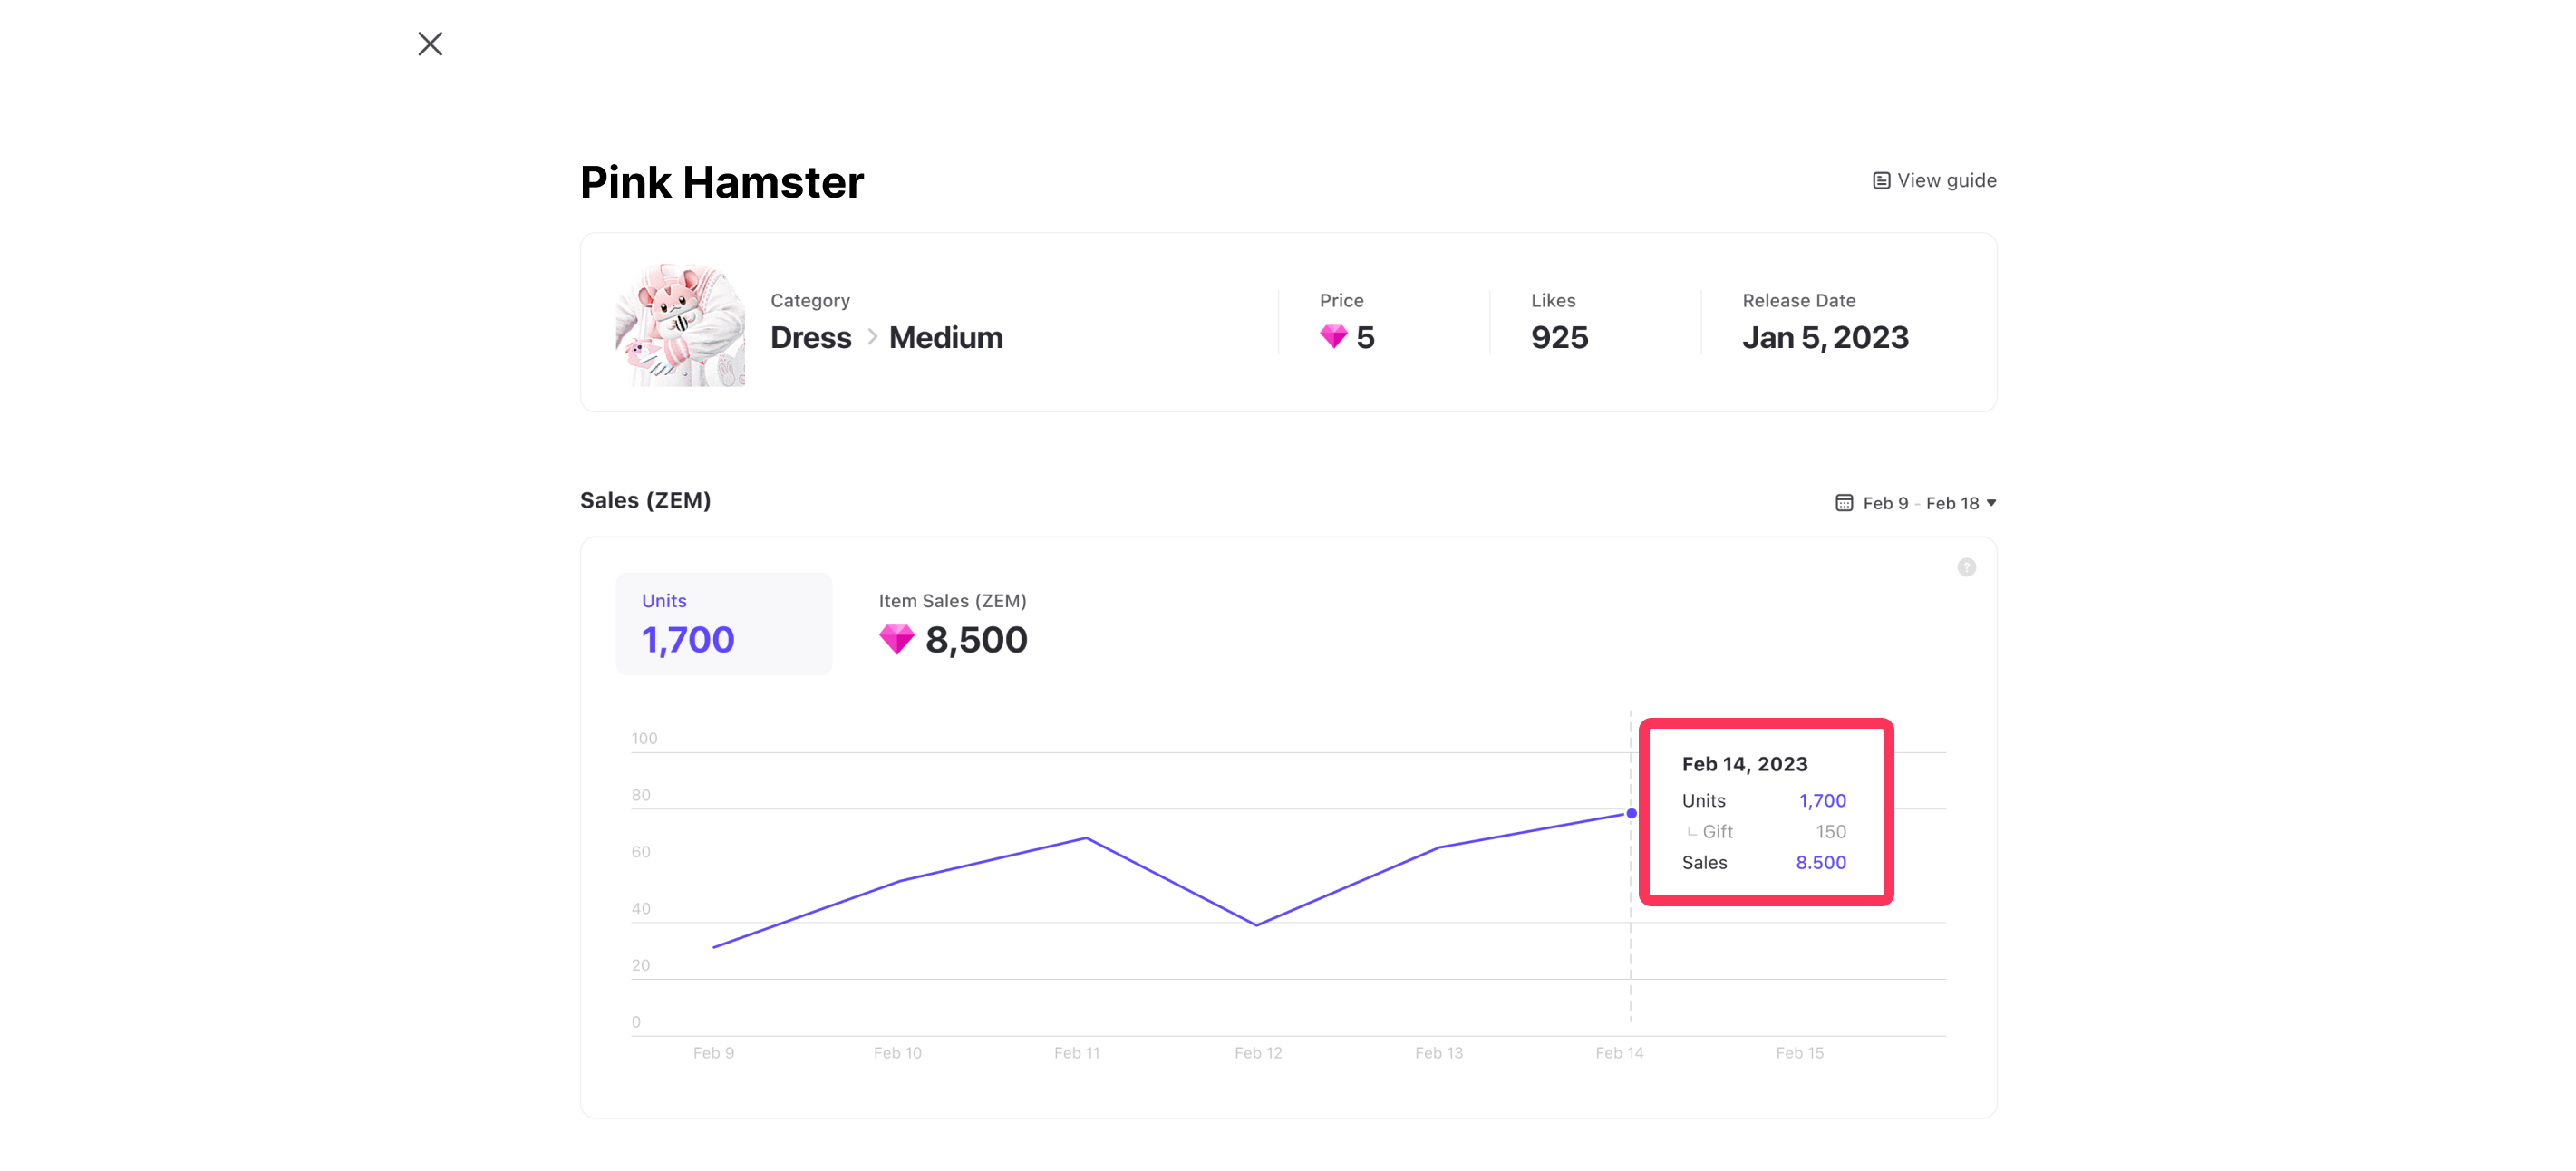
Item detail page
- Item Search: You can search the name of an item that is currently on sale to view its details page. Note that only up to 30 item search results are displayed.
If the insights do not appear, please check if the item name is correct and search again.
- Likes : The number of likes the item has received in the app.
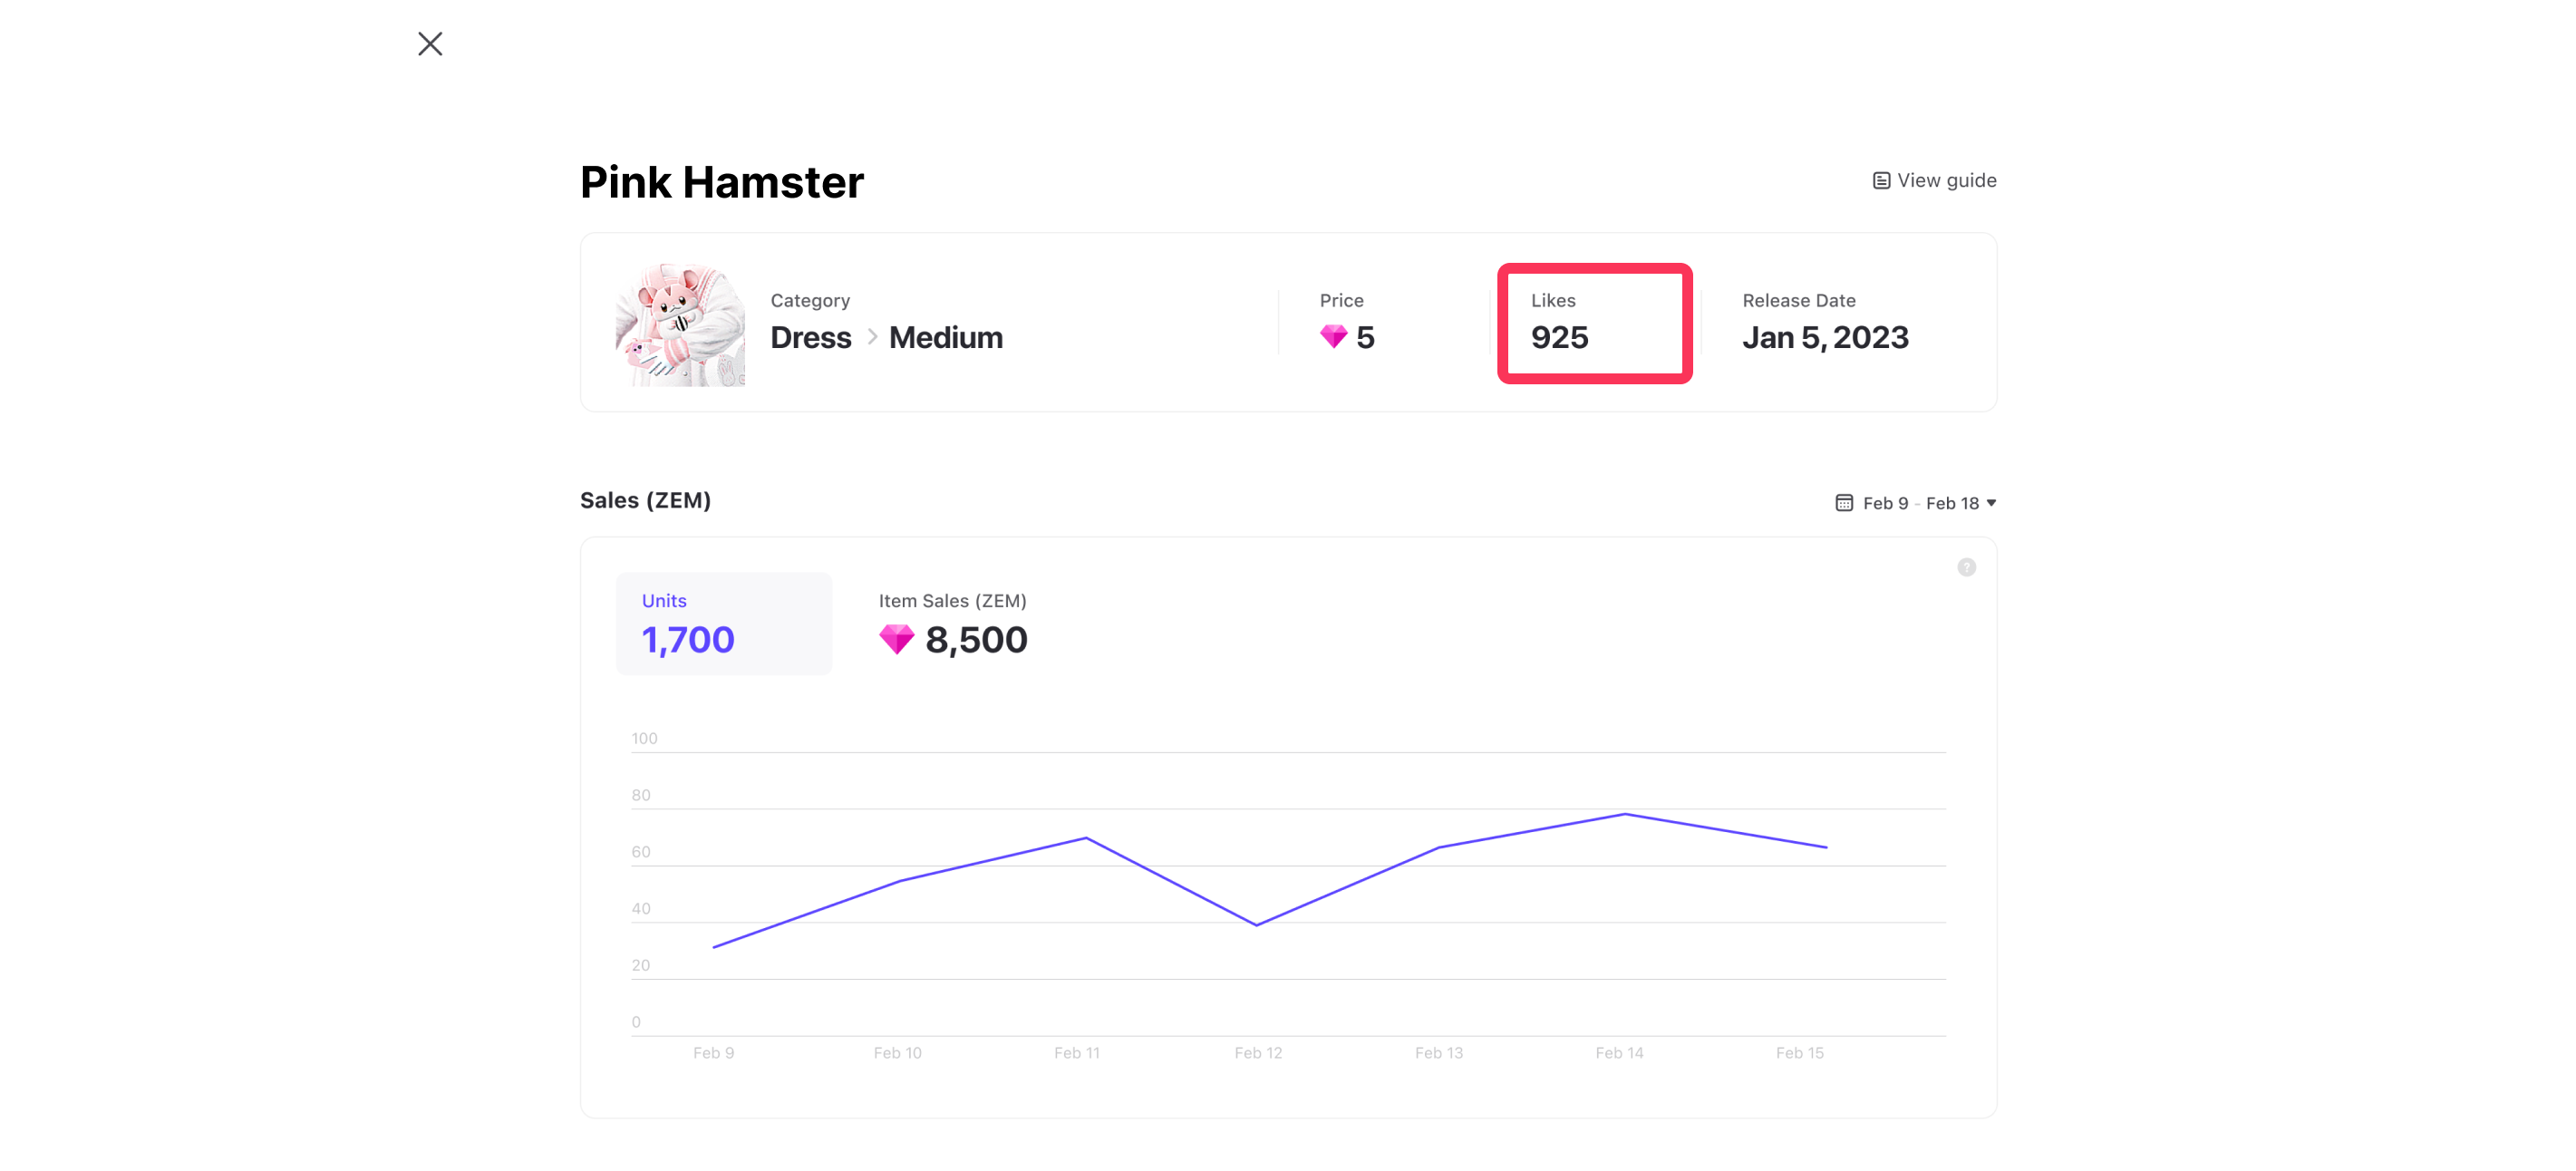
If you have a lot of likes but few sales, lower your price!
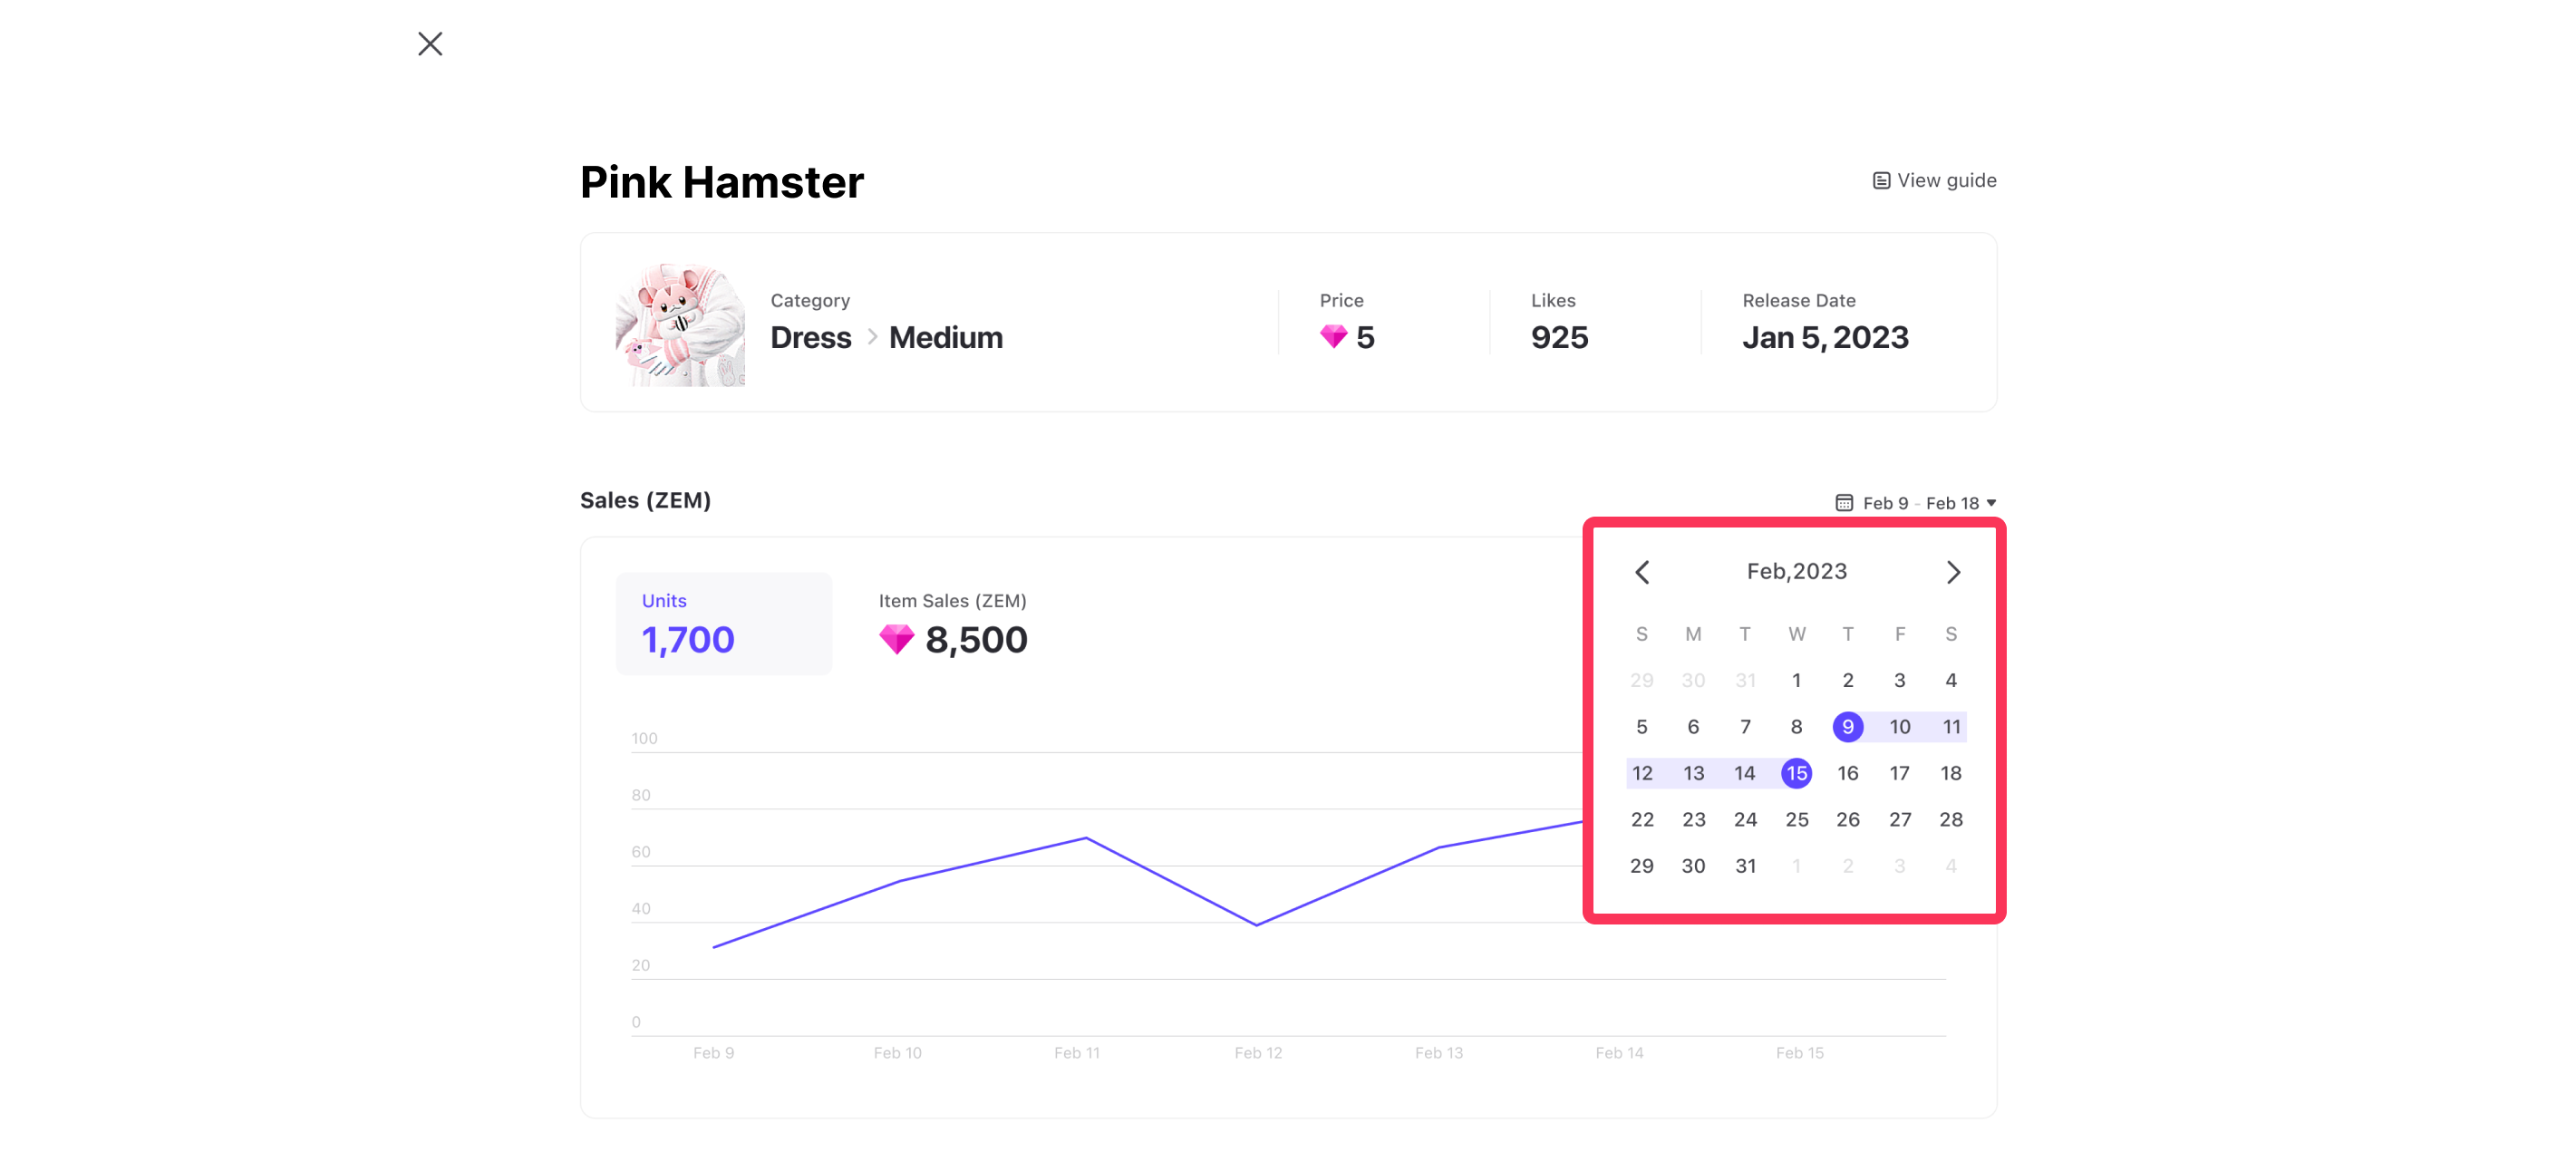
The number of sales/revenue of an item within a one-week period from the date of viewing is displayed in a graph and can be viewed by setting a time period.
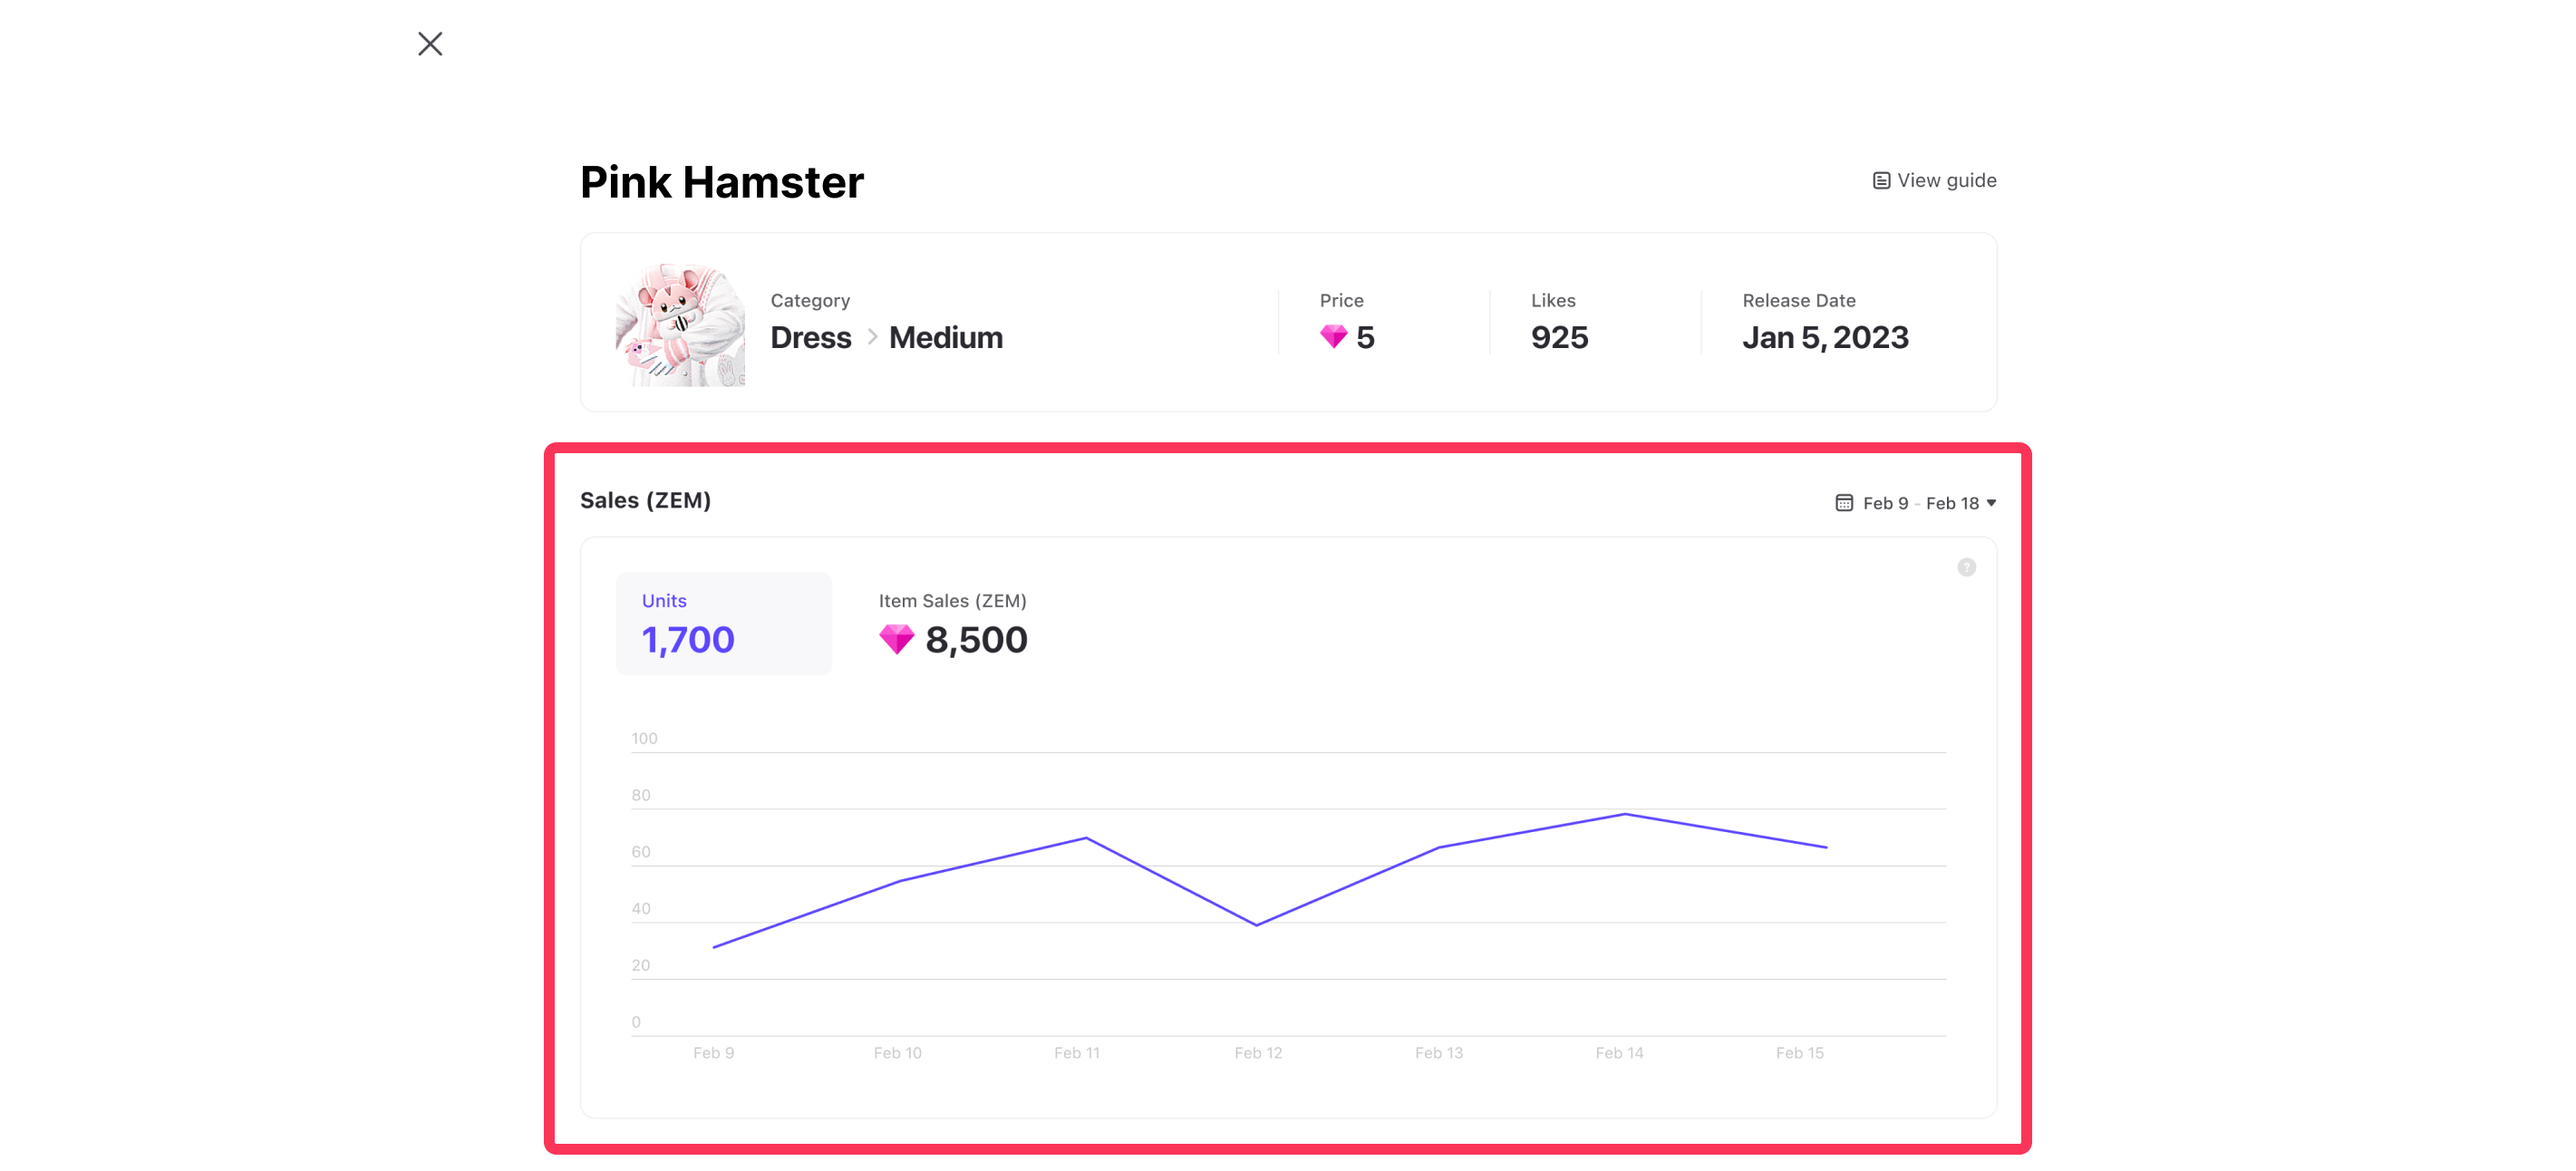
The start date can only be set after the item approval date and can be viewed for a minimum of 1 day and a maximum of 31 days in the calendar.
You can check the data by date, and if a sale was made as a gift, it is displayed as a gift.
ex) In the case of UNITS 200 / GIFT 50: 50 units were gifted out of a total of 200 units sold.
The data is aggregated by day and includes refunds that occurred up to the previous day, but does not include refunds on the same day.
The metrics provided on this page may differ from the sales quantity/revenue used for actual settlement.
Buyer Nationality
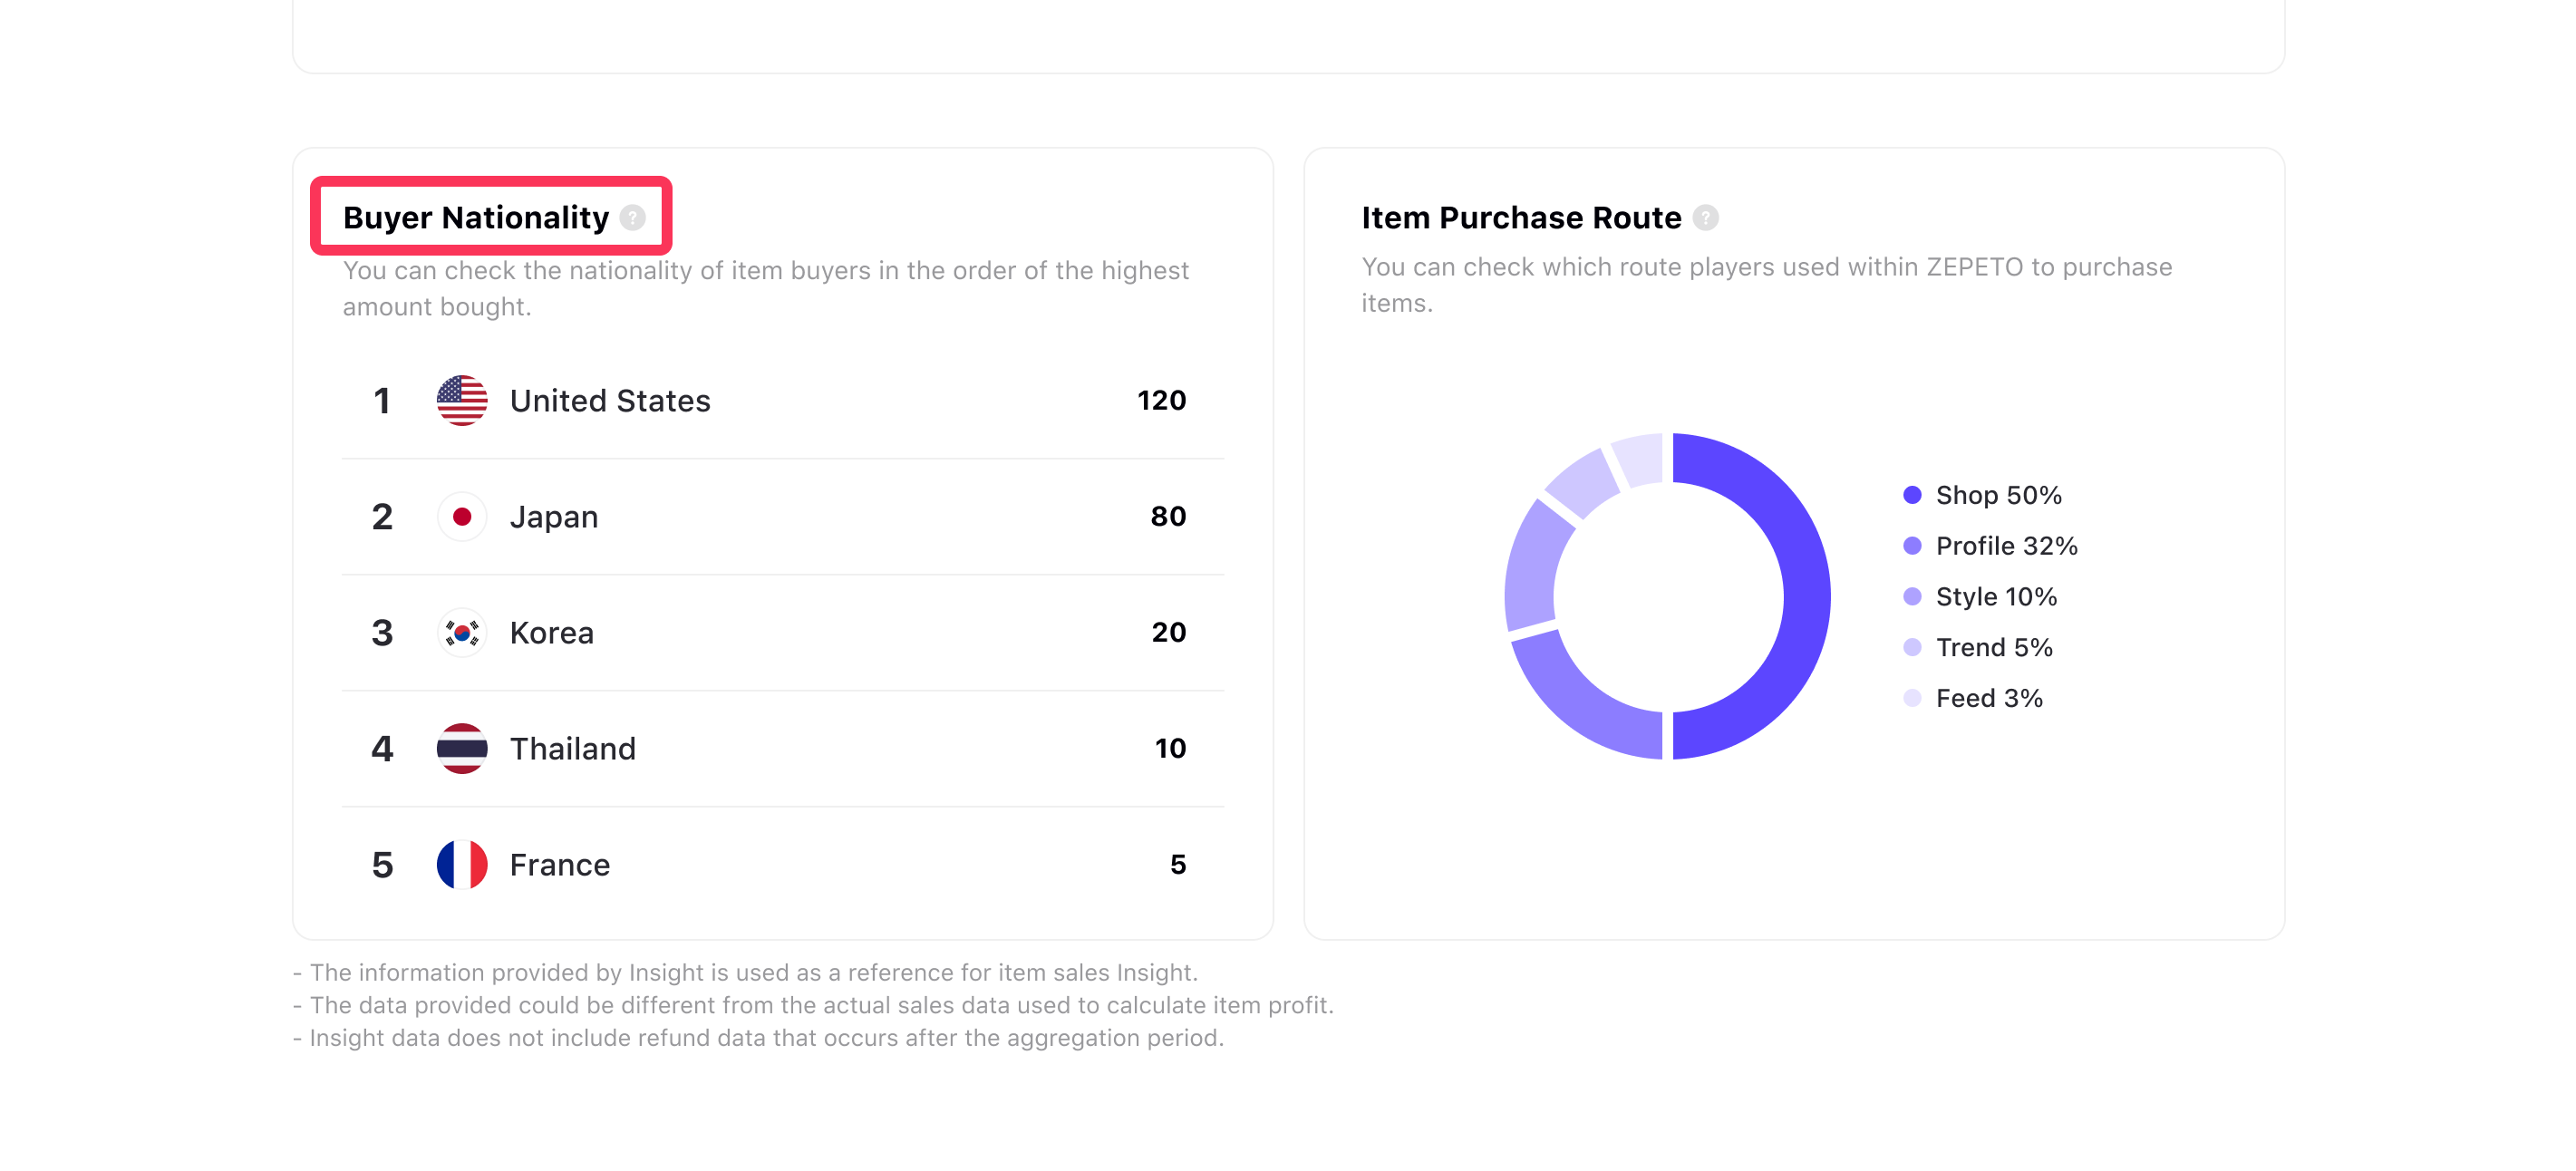
The country information of the user who purchased the item appears. The country information shows the top five countries in the sales ranking, and you can see the number of countries and users. Buyer Nationality data is available from March, 2023.
The metrics provided on this page may differ from the actual sales quantity/revenue used for settlement.
Item Purchase Route
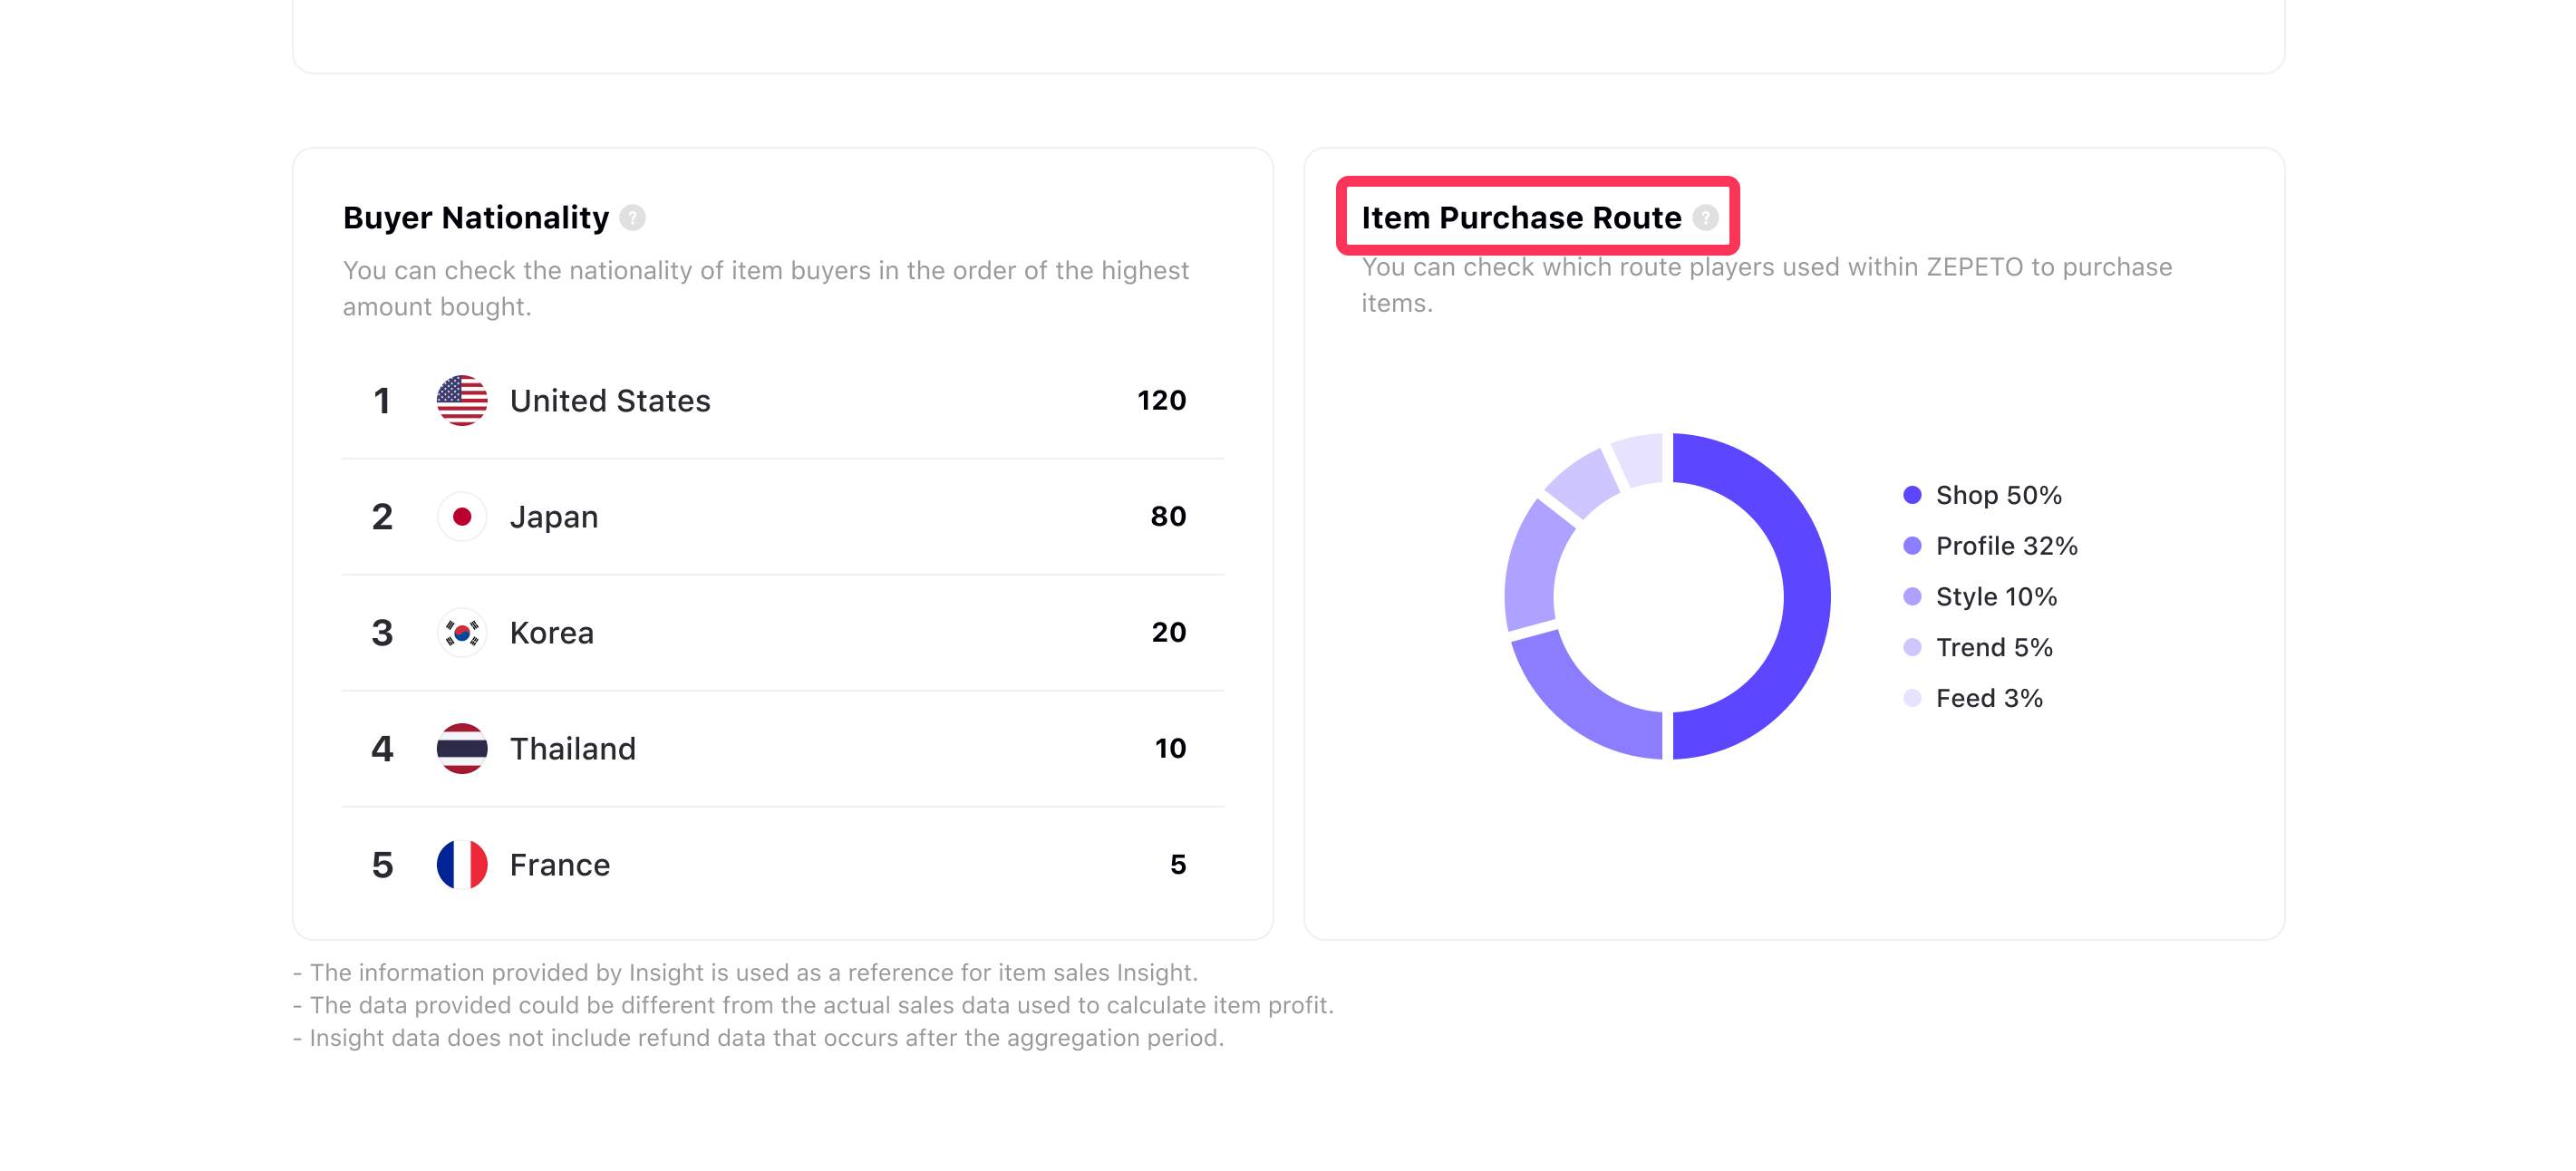
Shows the path to purchase for up to 5 items in a pie graph. Item Purchase Route data is available from March, 2023.
The metrics provided on this page may differ from the actual sales volume/revenue used for settlement.
Insight > Live
You can check the indicators for the live you've hosted.
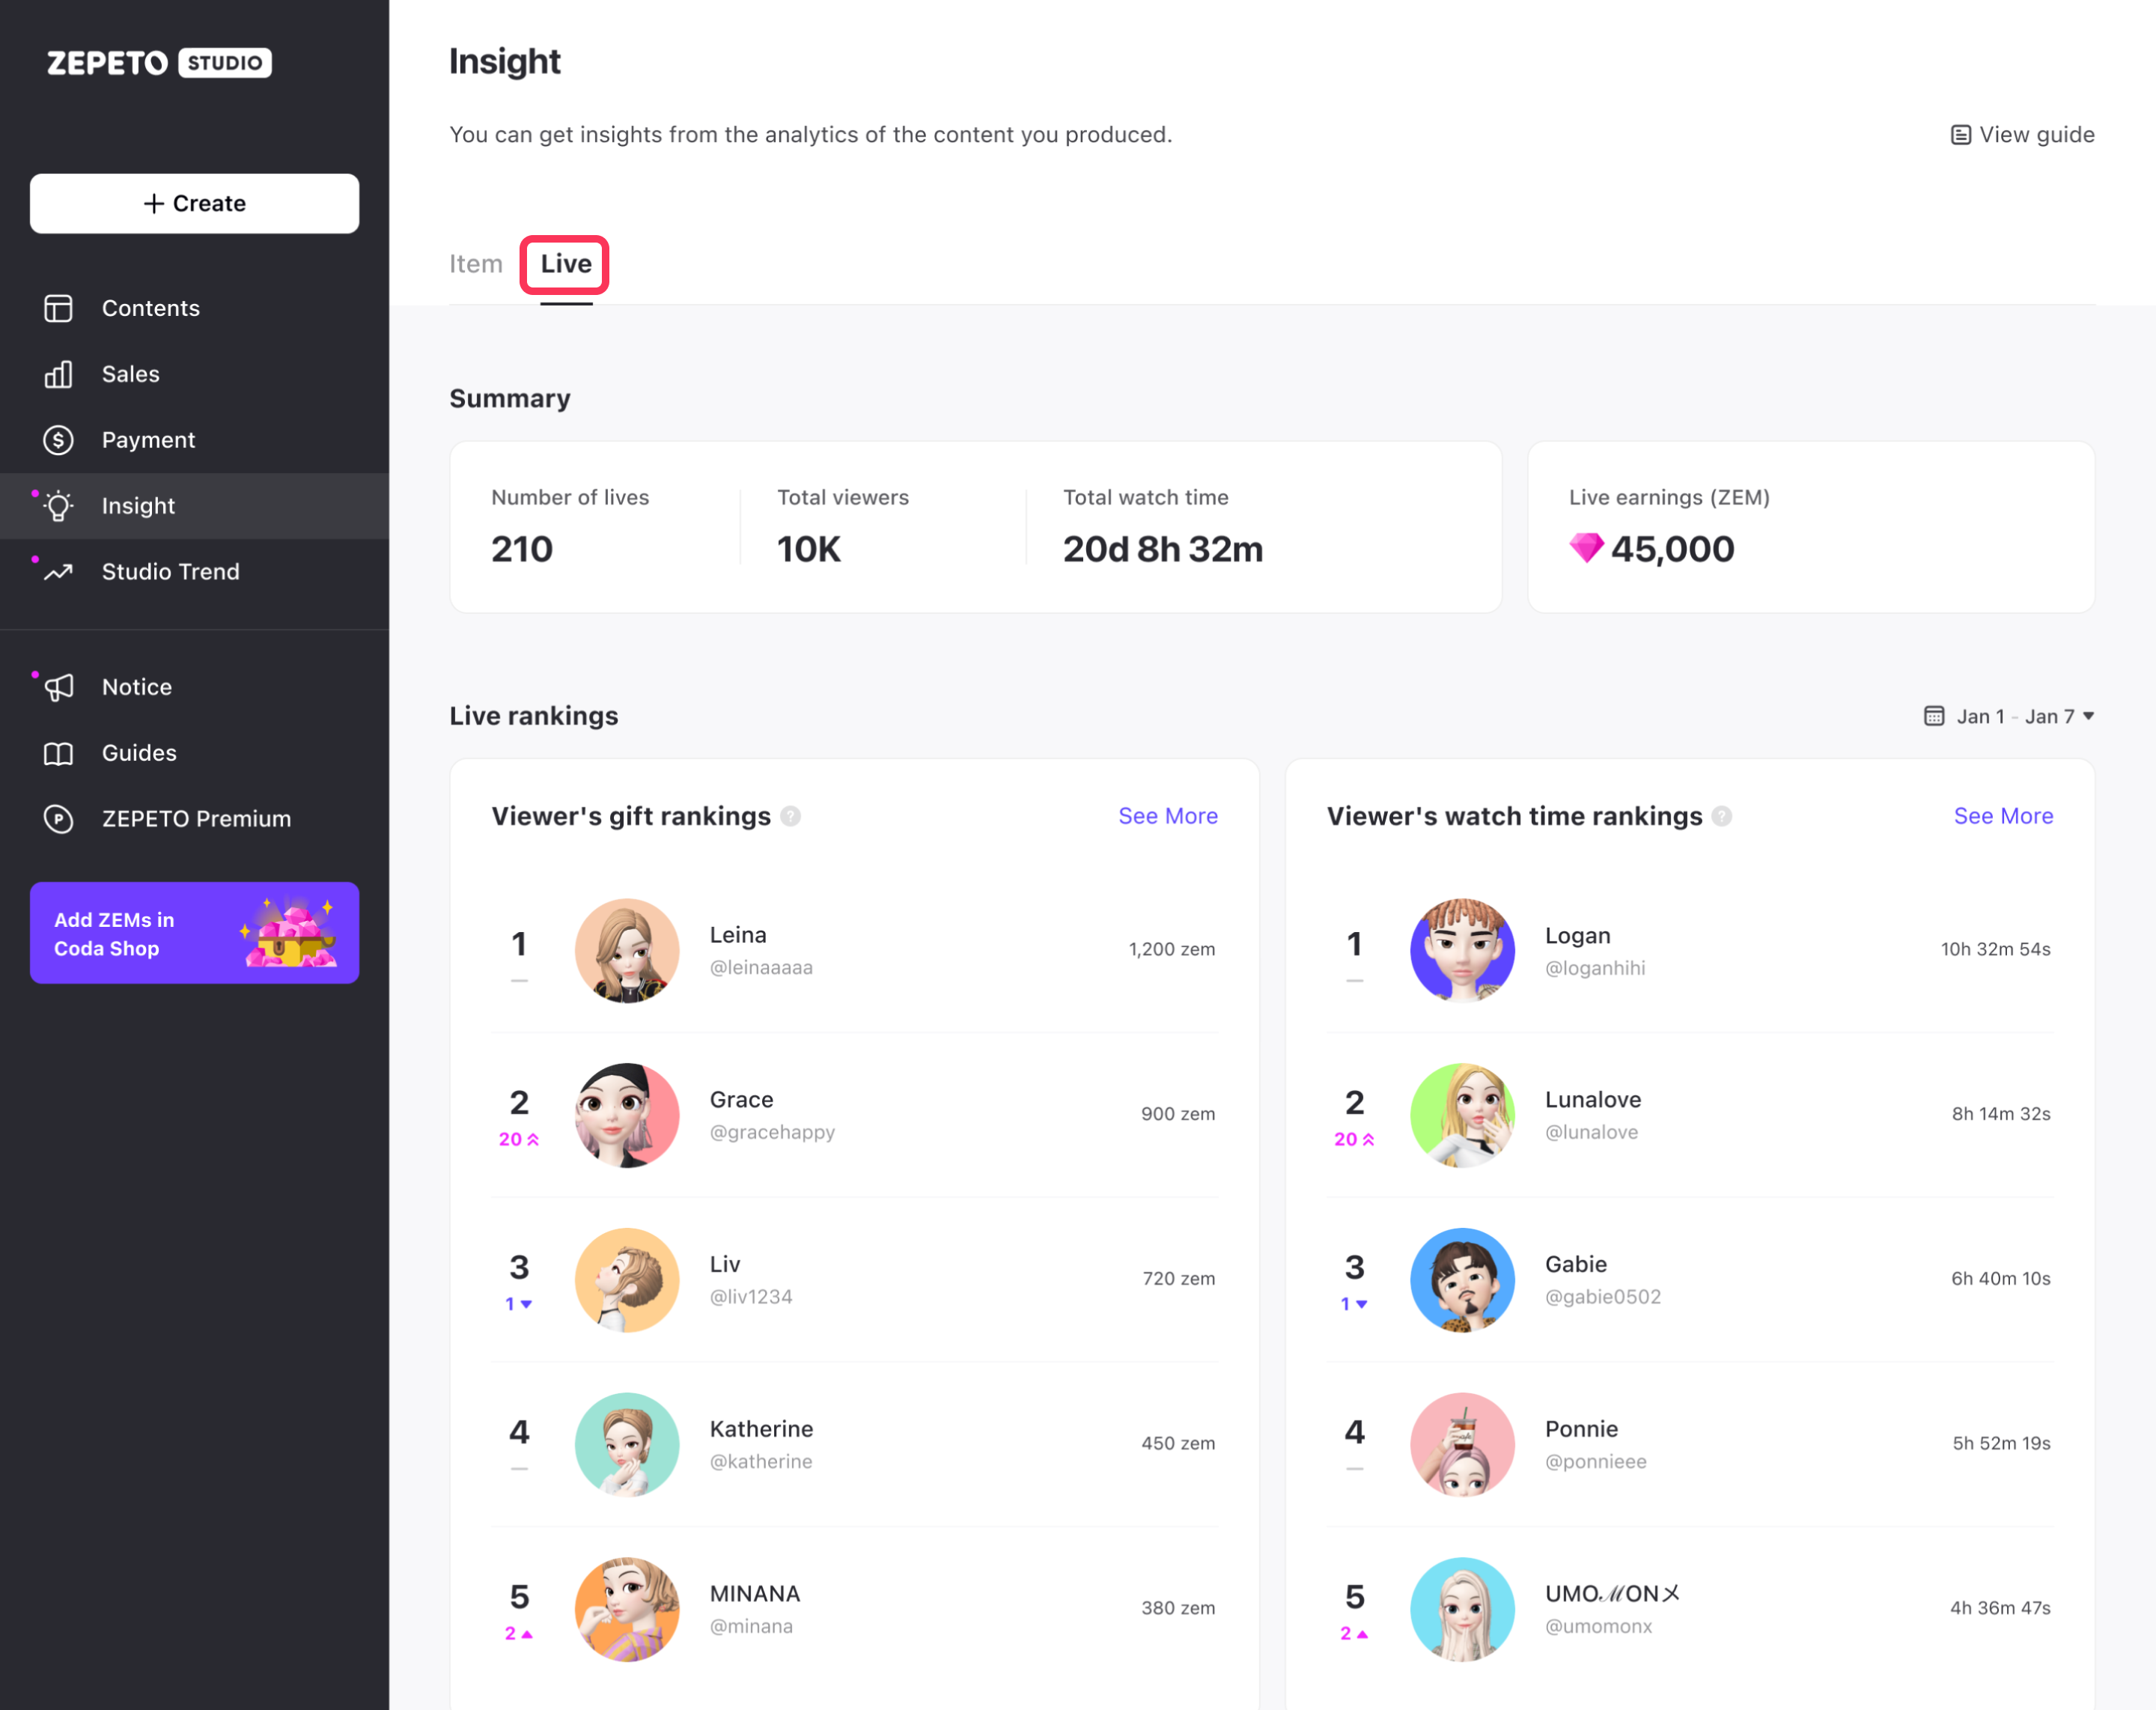
Summary
- Total Lives: Total number of live sessions.
- Total Viewers: Total number of viewers who watched the live.
- Total Airtime: Total amount of time you have gone live.
- Total Revenue: Total revenue from gifts (in ZEM units).

All data are based on the time of viewing and are aggregated on a daily basis.
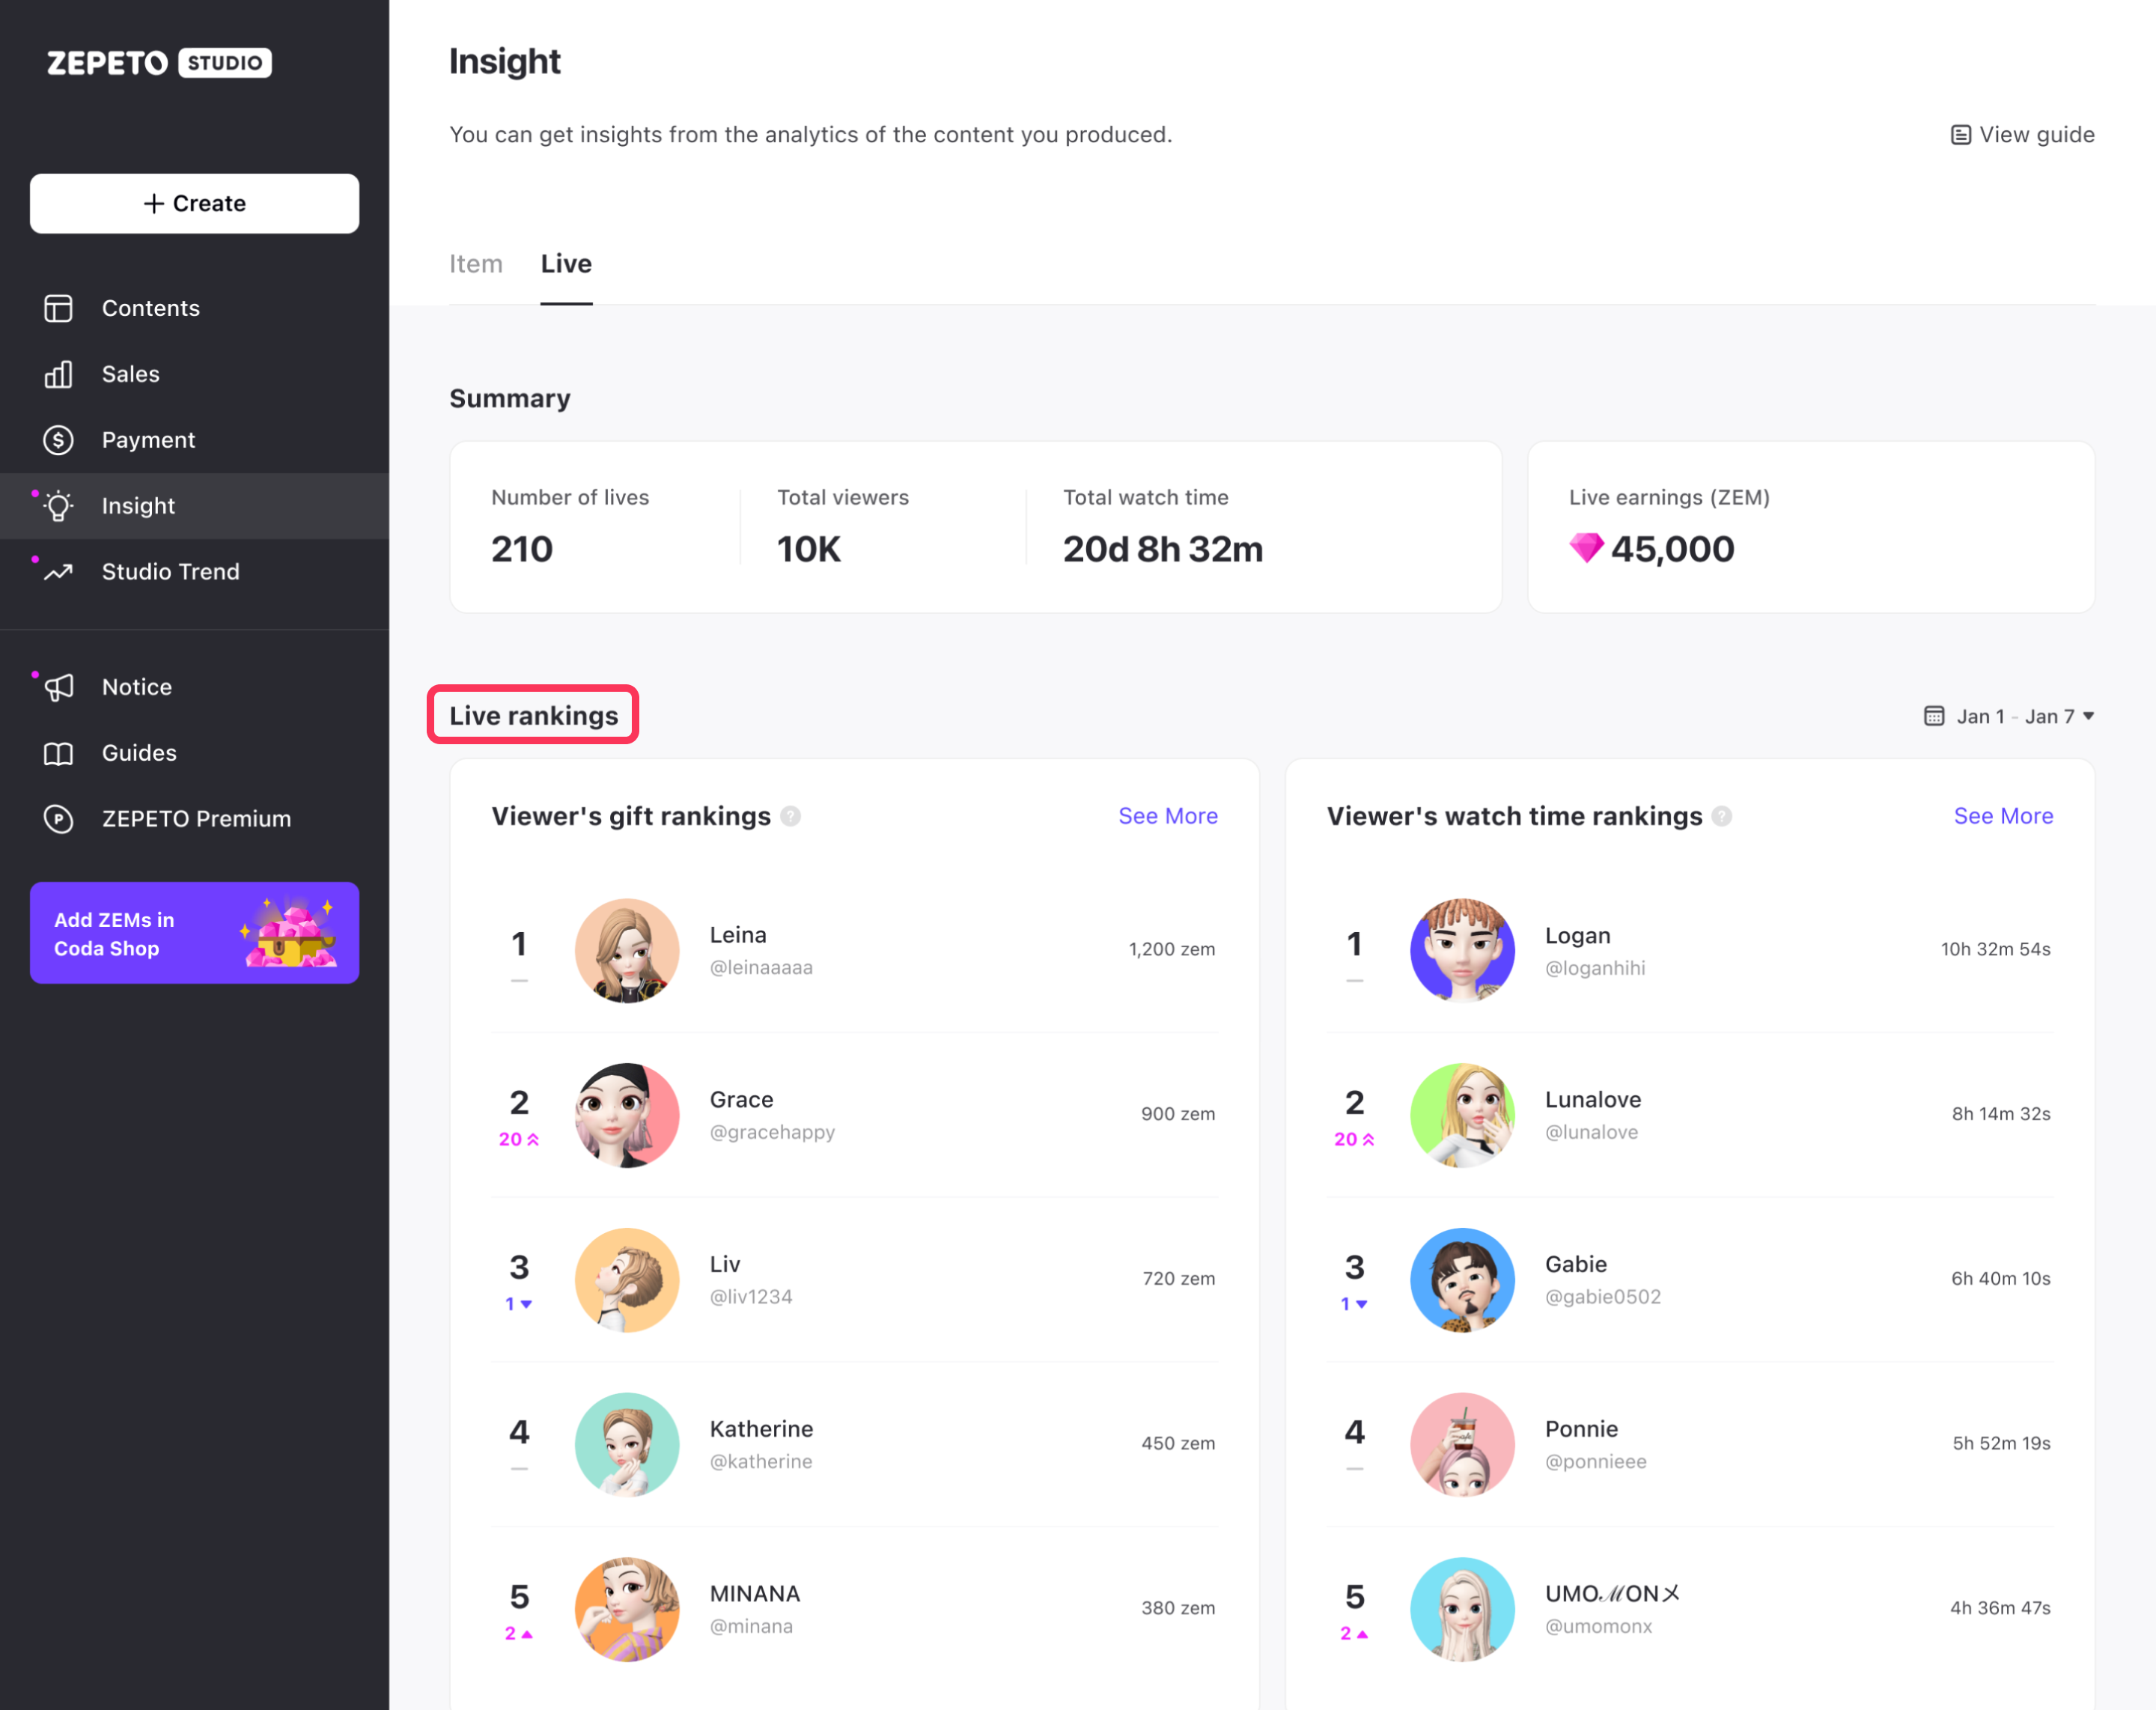
Live ranking
You can view aggregate data about your live and the amount of time your viewers watched and the ZEMs they gifted.
- Viewers' Gift Ranking: Viewers who gifted a high number of ZEMs to your live.
- Viewers' Watch Time Ranking: Viewers with significant live-watching time.
- Most Viewed Live Ranking: Live sessions with the highest viewership.
- Top Supported Live Ranking: Live sessions with the highest revenue (in ZEMs).
Viewers included in the Live ranking may be included in the ranking even if they delete their account, but details cannot be viewed.
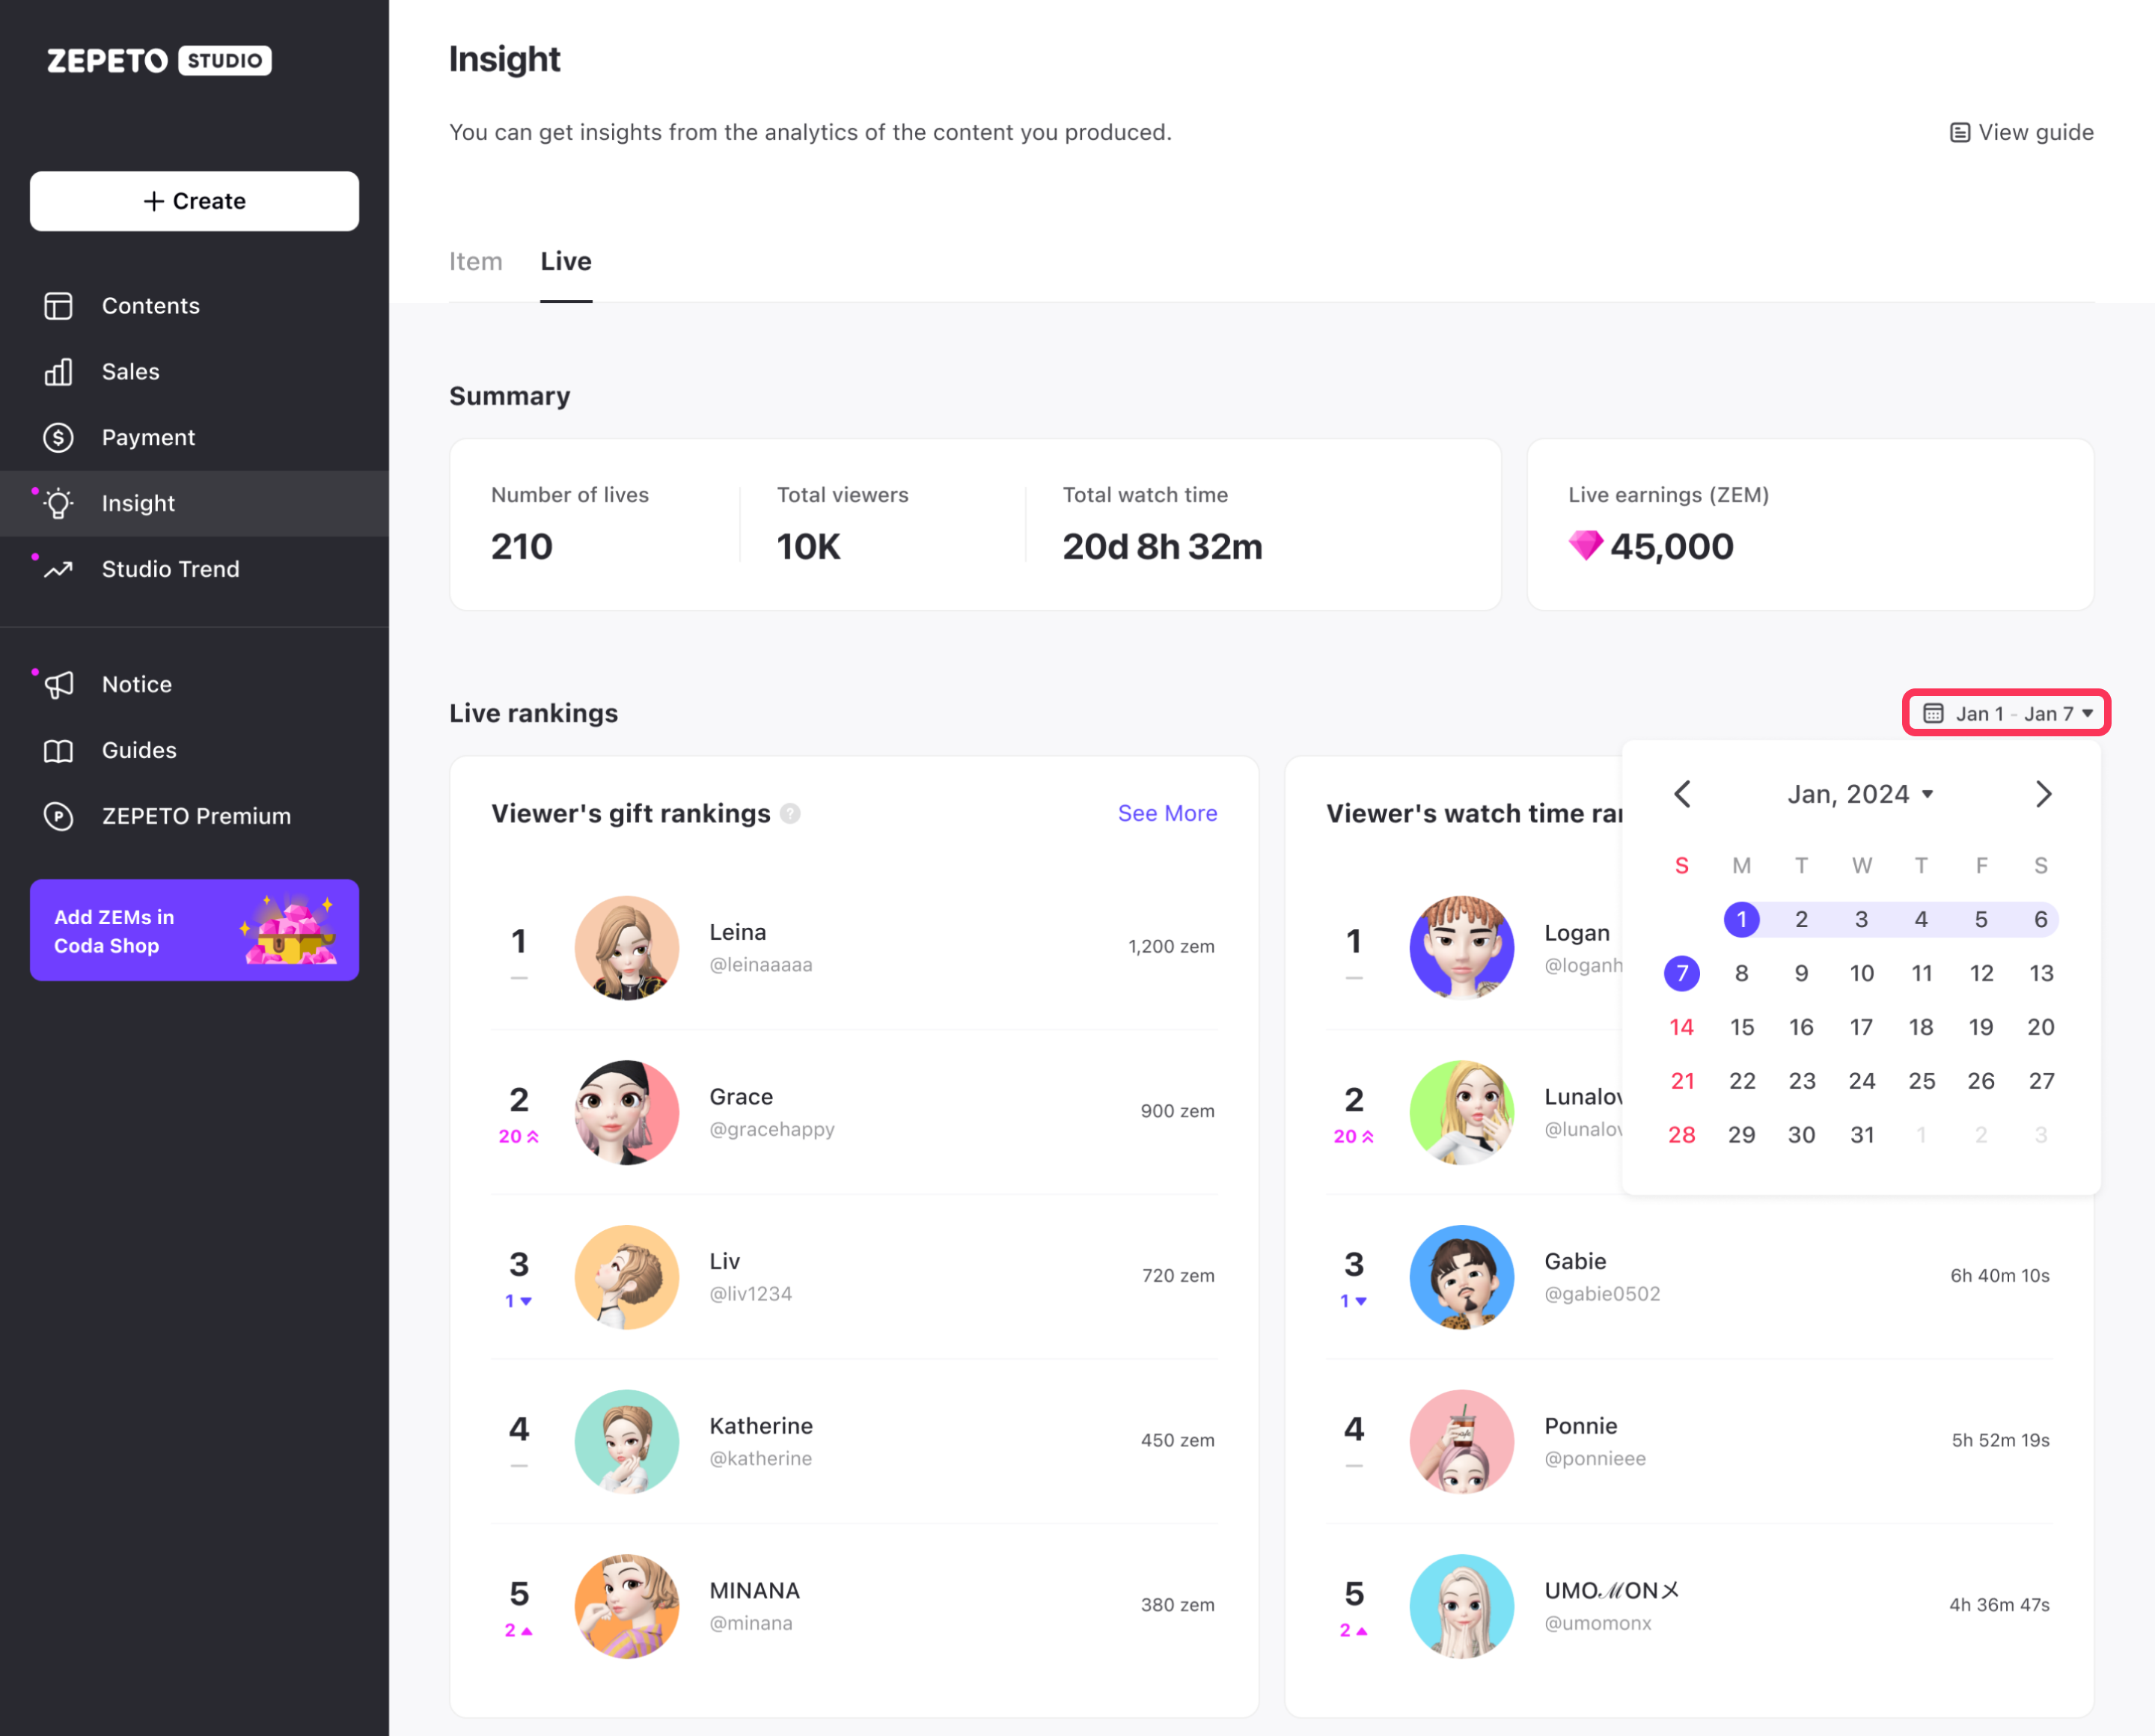
You can set a time period to view your Live Rankings.
The rankings are only counted within the live you hosted.
The Viewers' Gift Ranking and Watch Time Ranking reflect changes in viewer behavior, categorizing them as Rise, Spike, New, or Fall compared to the previous period's ranking within the same time frame. However, weekly rankings are available for viewing only on a monthly to daily basis.
ex) If you set the period between 01/15/2023 and 01/21/2023, you can compare it with the data from 01/08/2023 to 01/14/2023, which is one week ago.
- Spike: The ranking has surged by more than 20 positions compared to last week.
- New: Items that were absent from last week's ranking are now featured in the current ranking.
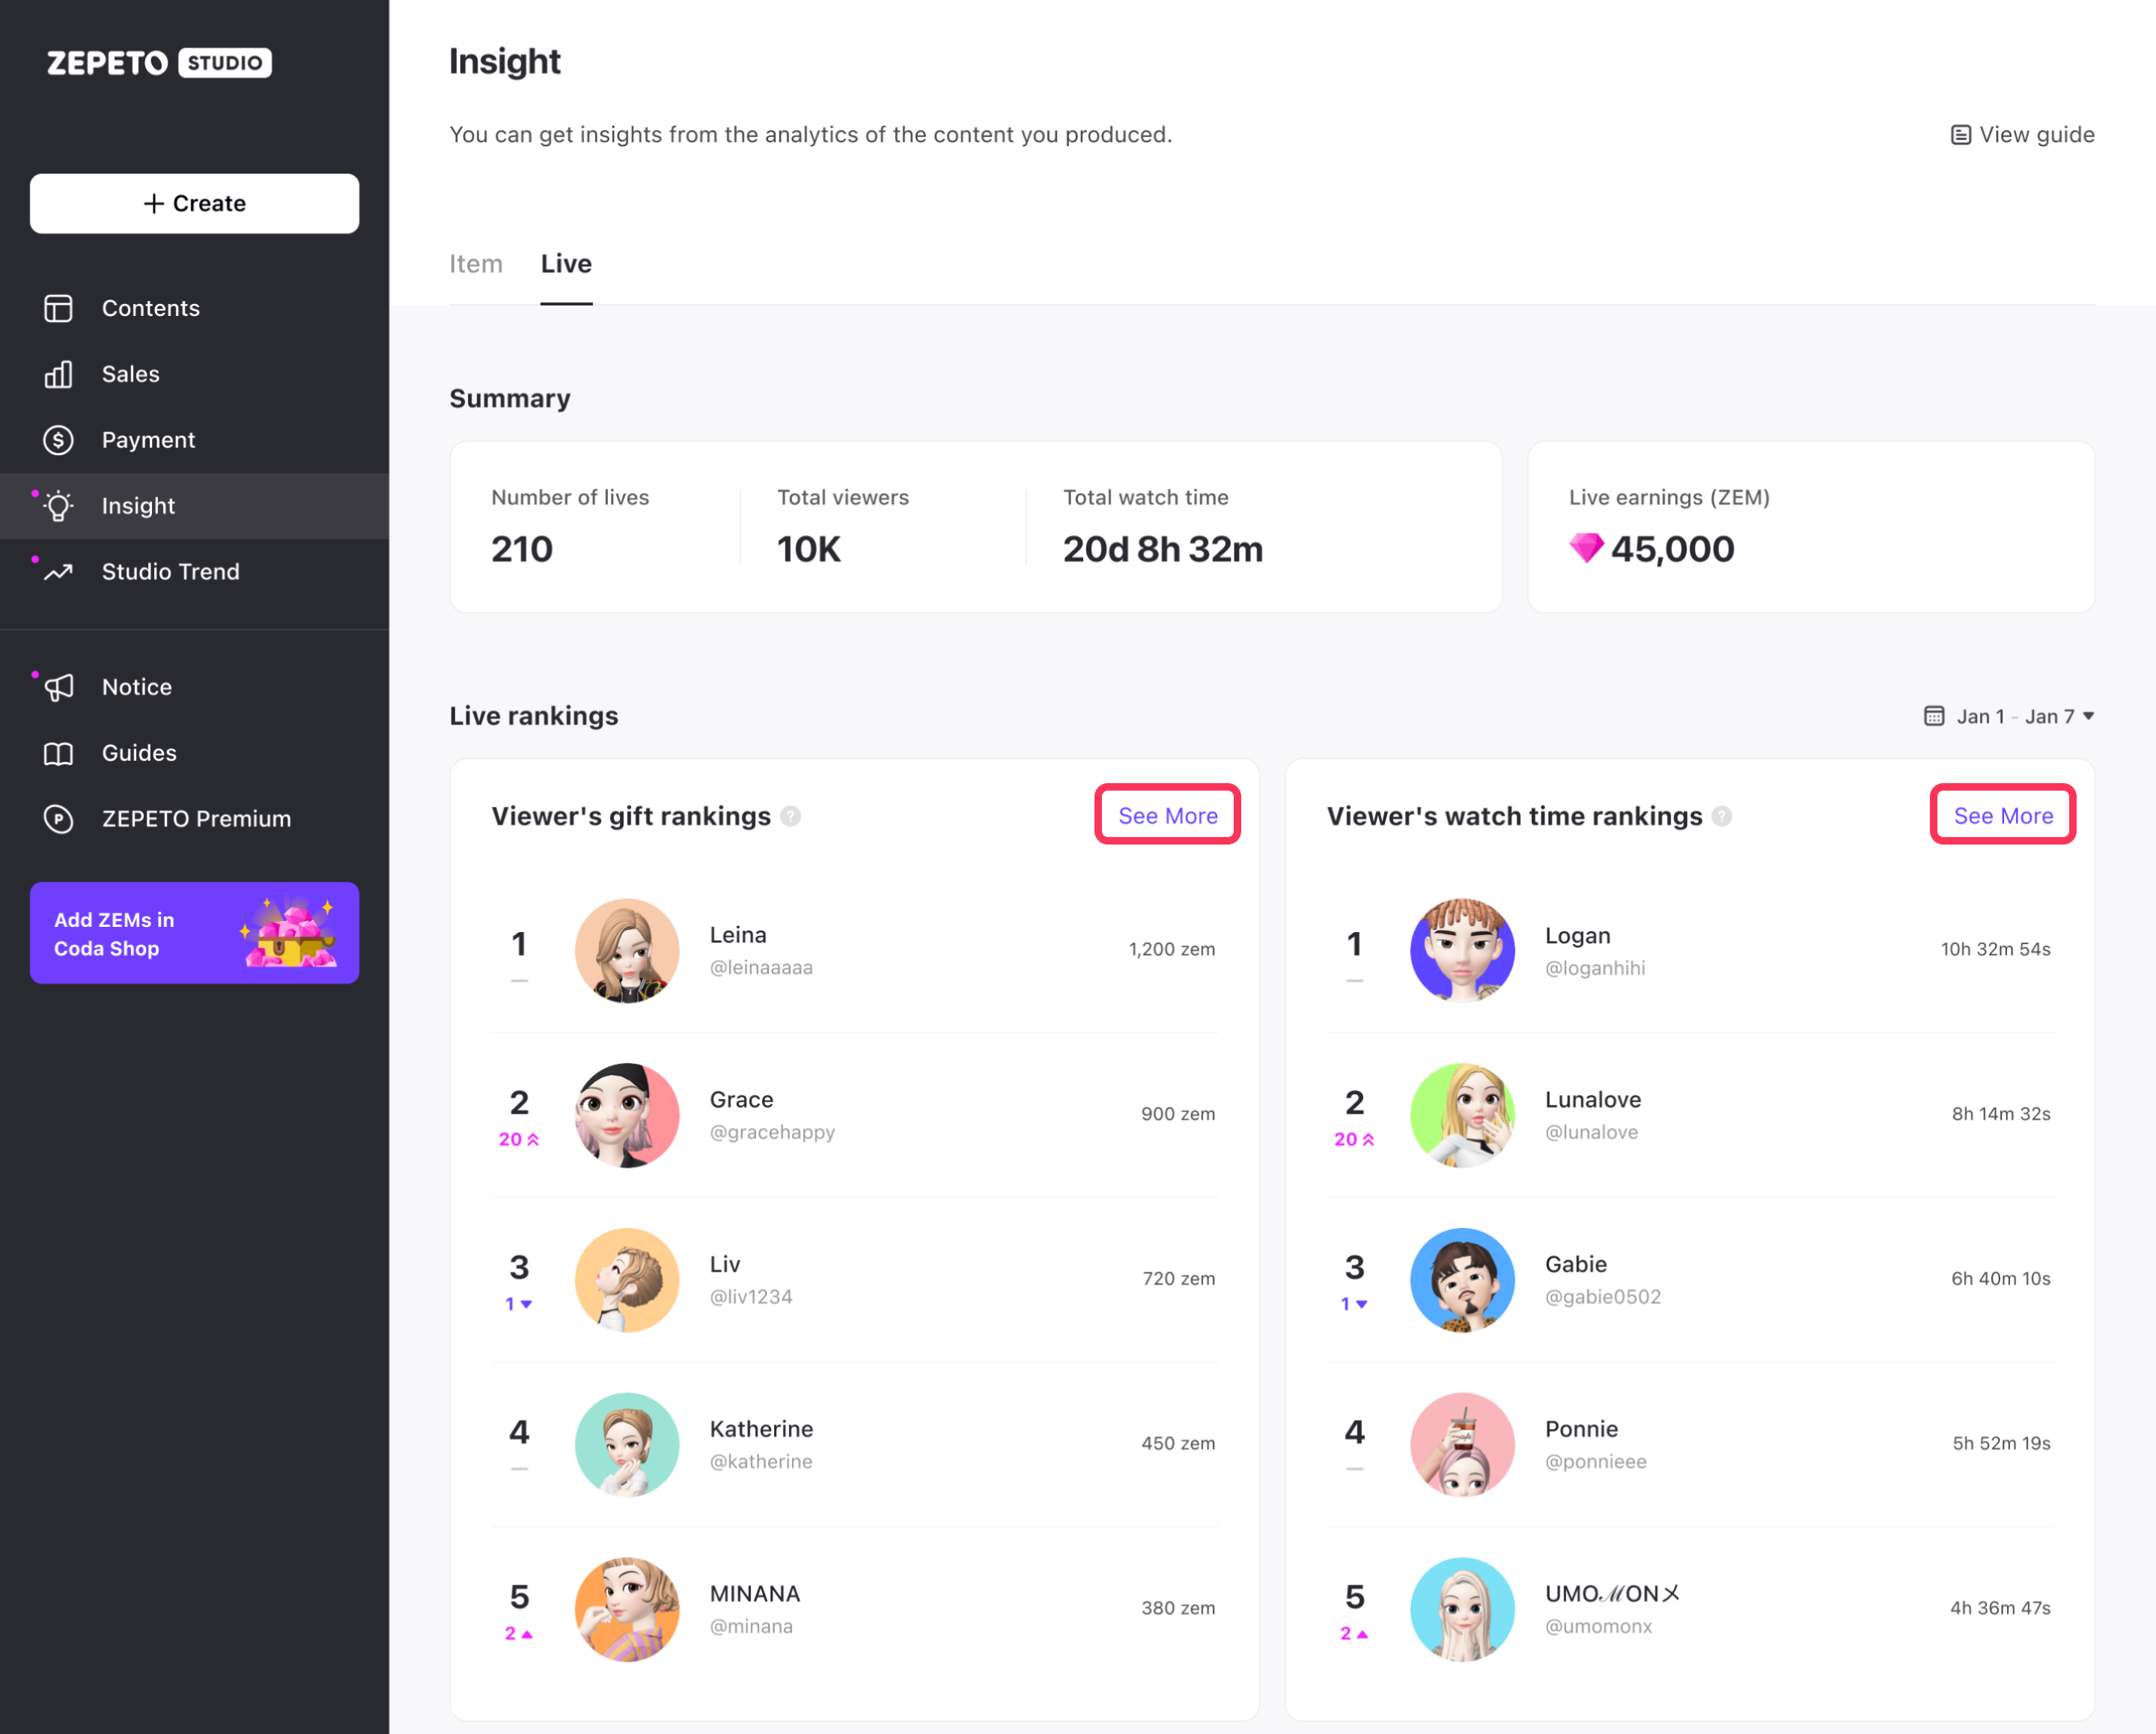
You can view up to the 20th position via the More button.
Refunds that occurred after the weekly aggregation point are not included in the Live Rankings aggregation.
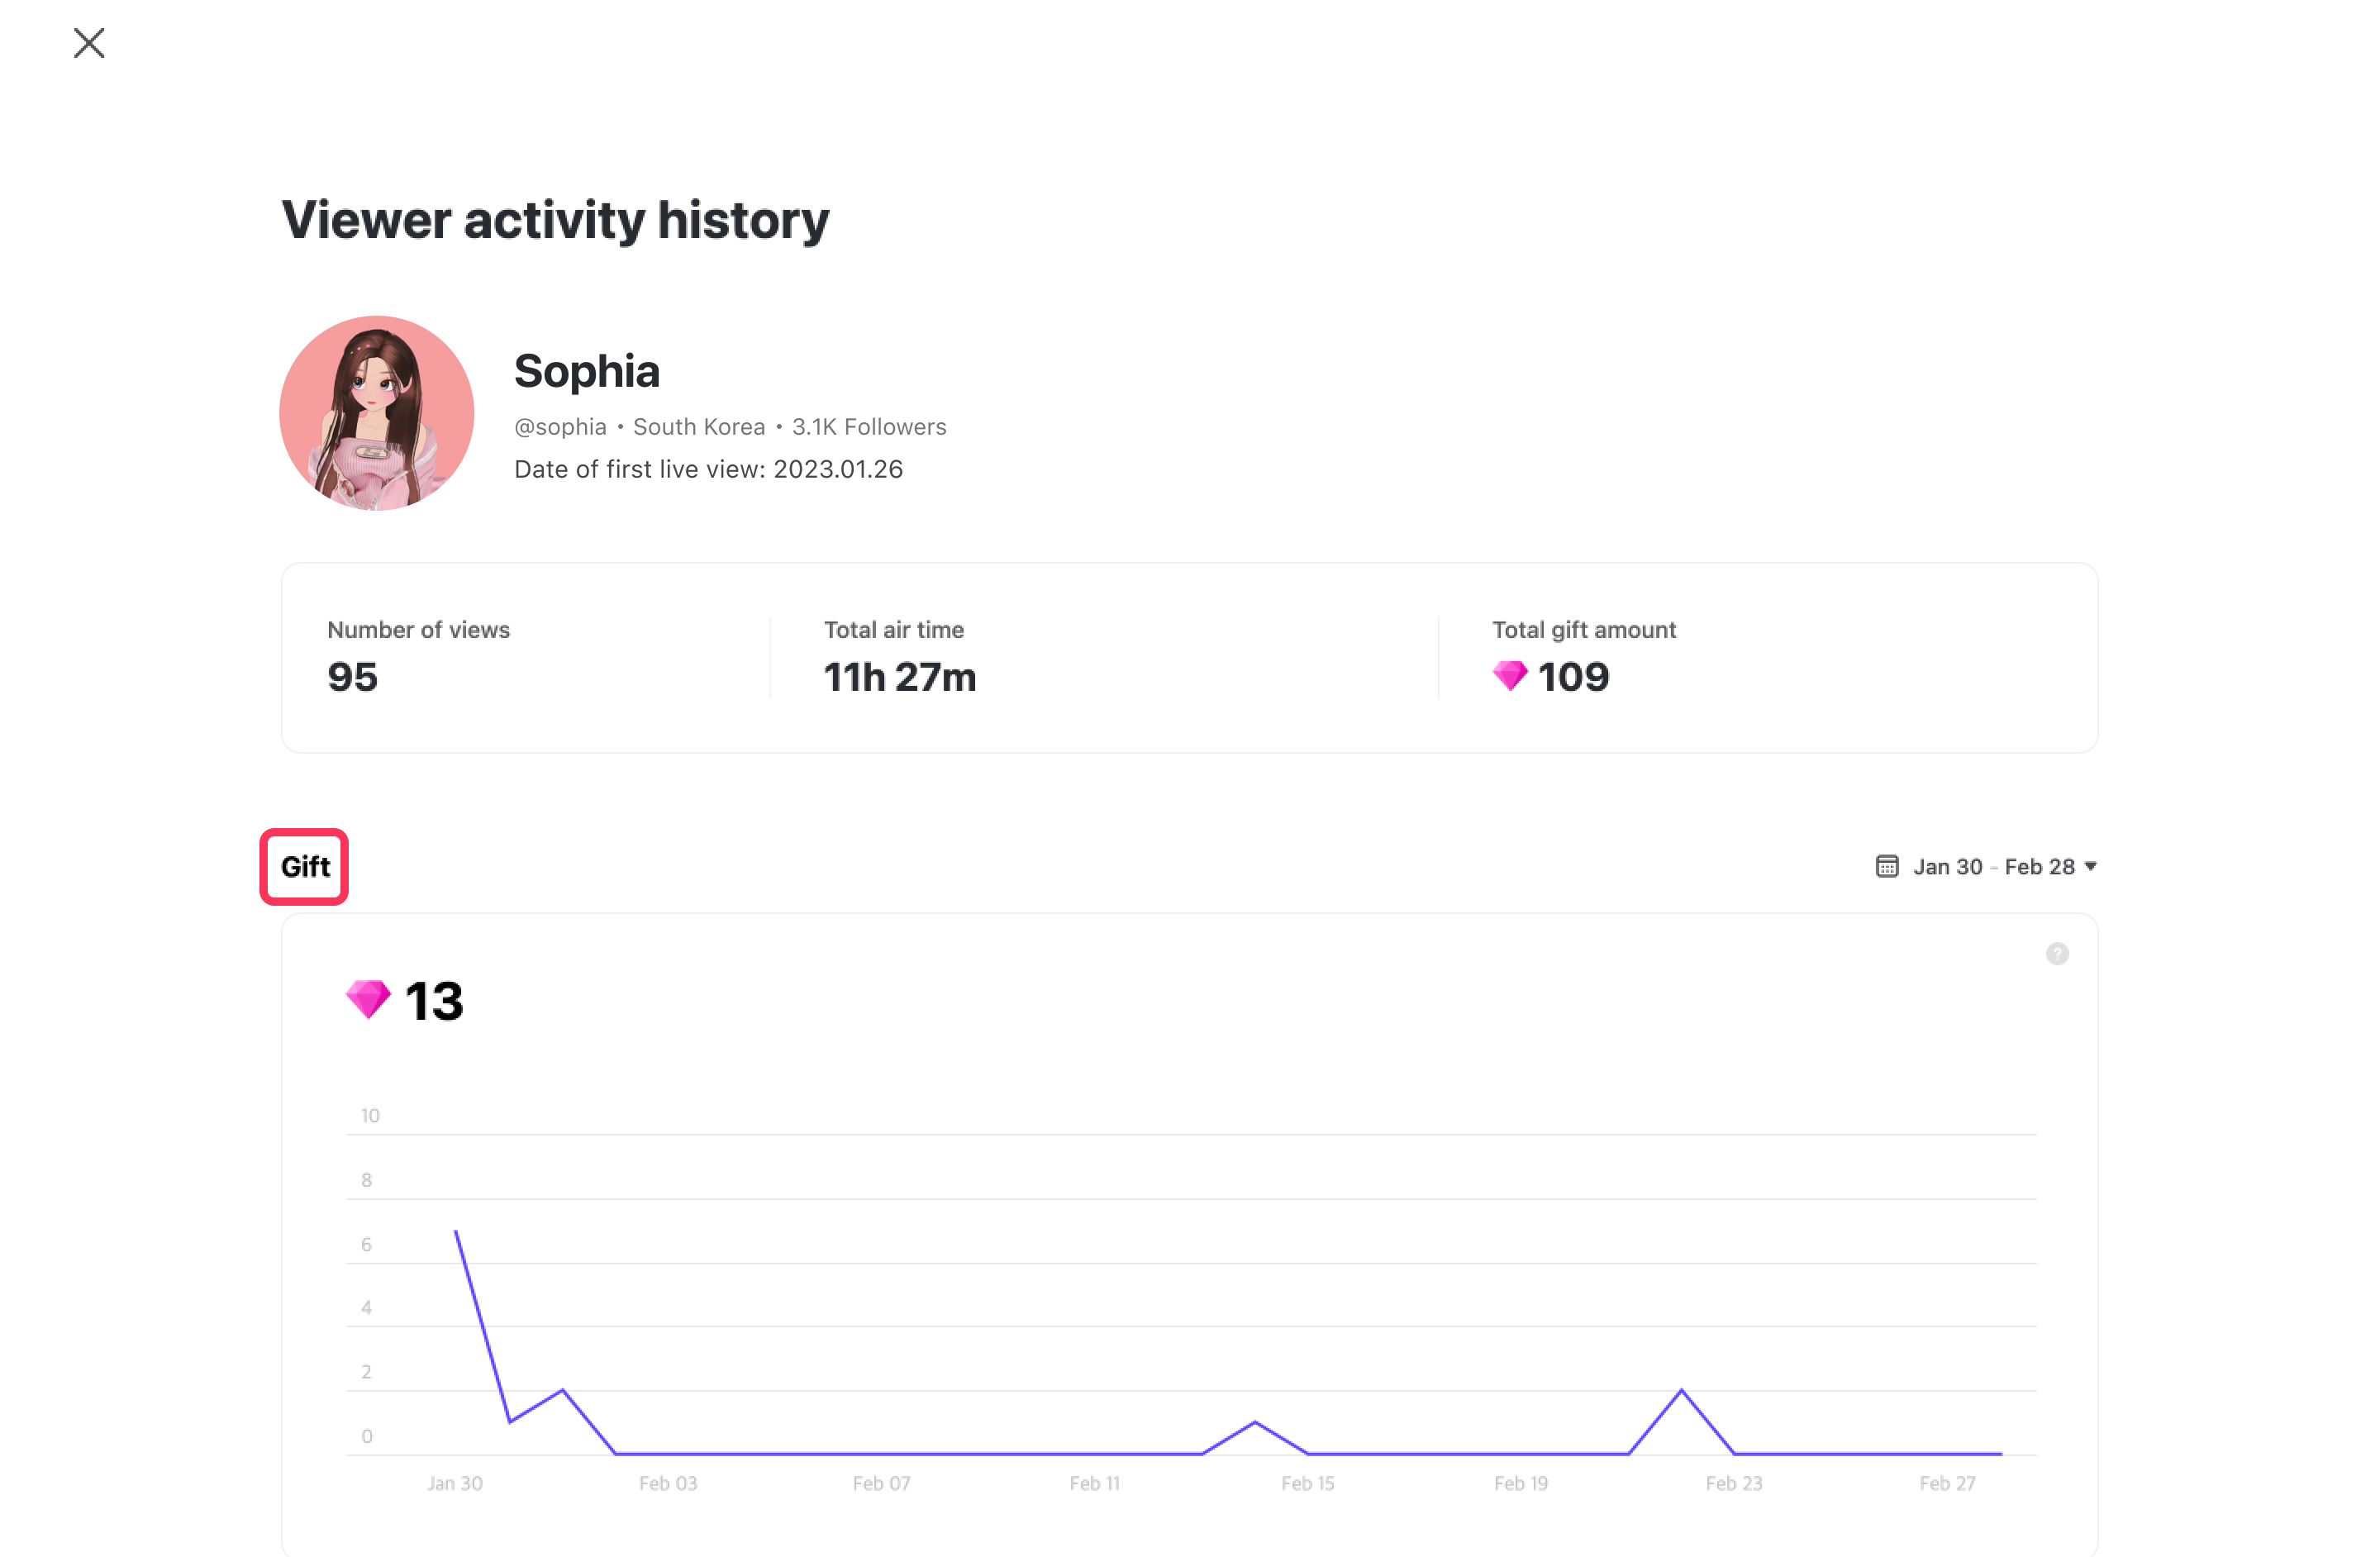
Viewer activity history
You can view the history of viewer activity by clicking on the viewer in a Viewer Gift Ranking and Viewer's Watch Time Ranking. The data is updated daily and does not include any refund details.
- Views: Total live views.
- Total Watch Time: Total time spent watching your live.
- Total Gift Amount (ZEM): Total amount gifted to your live.
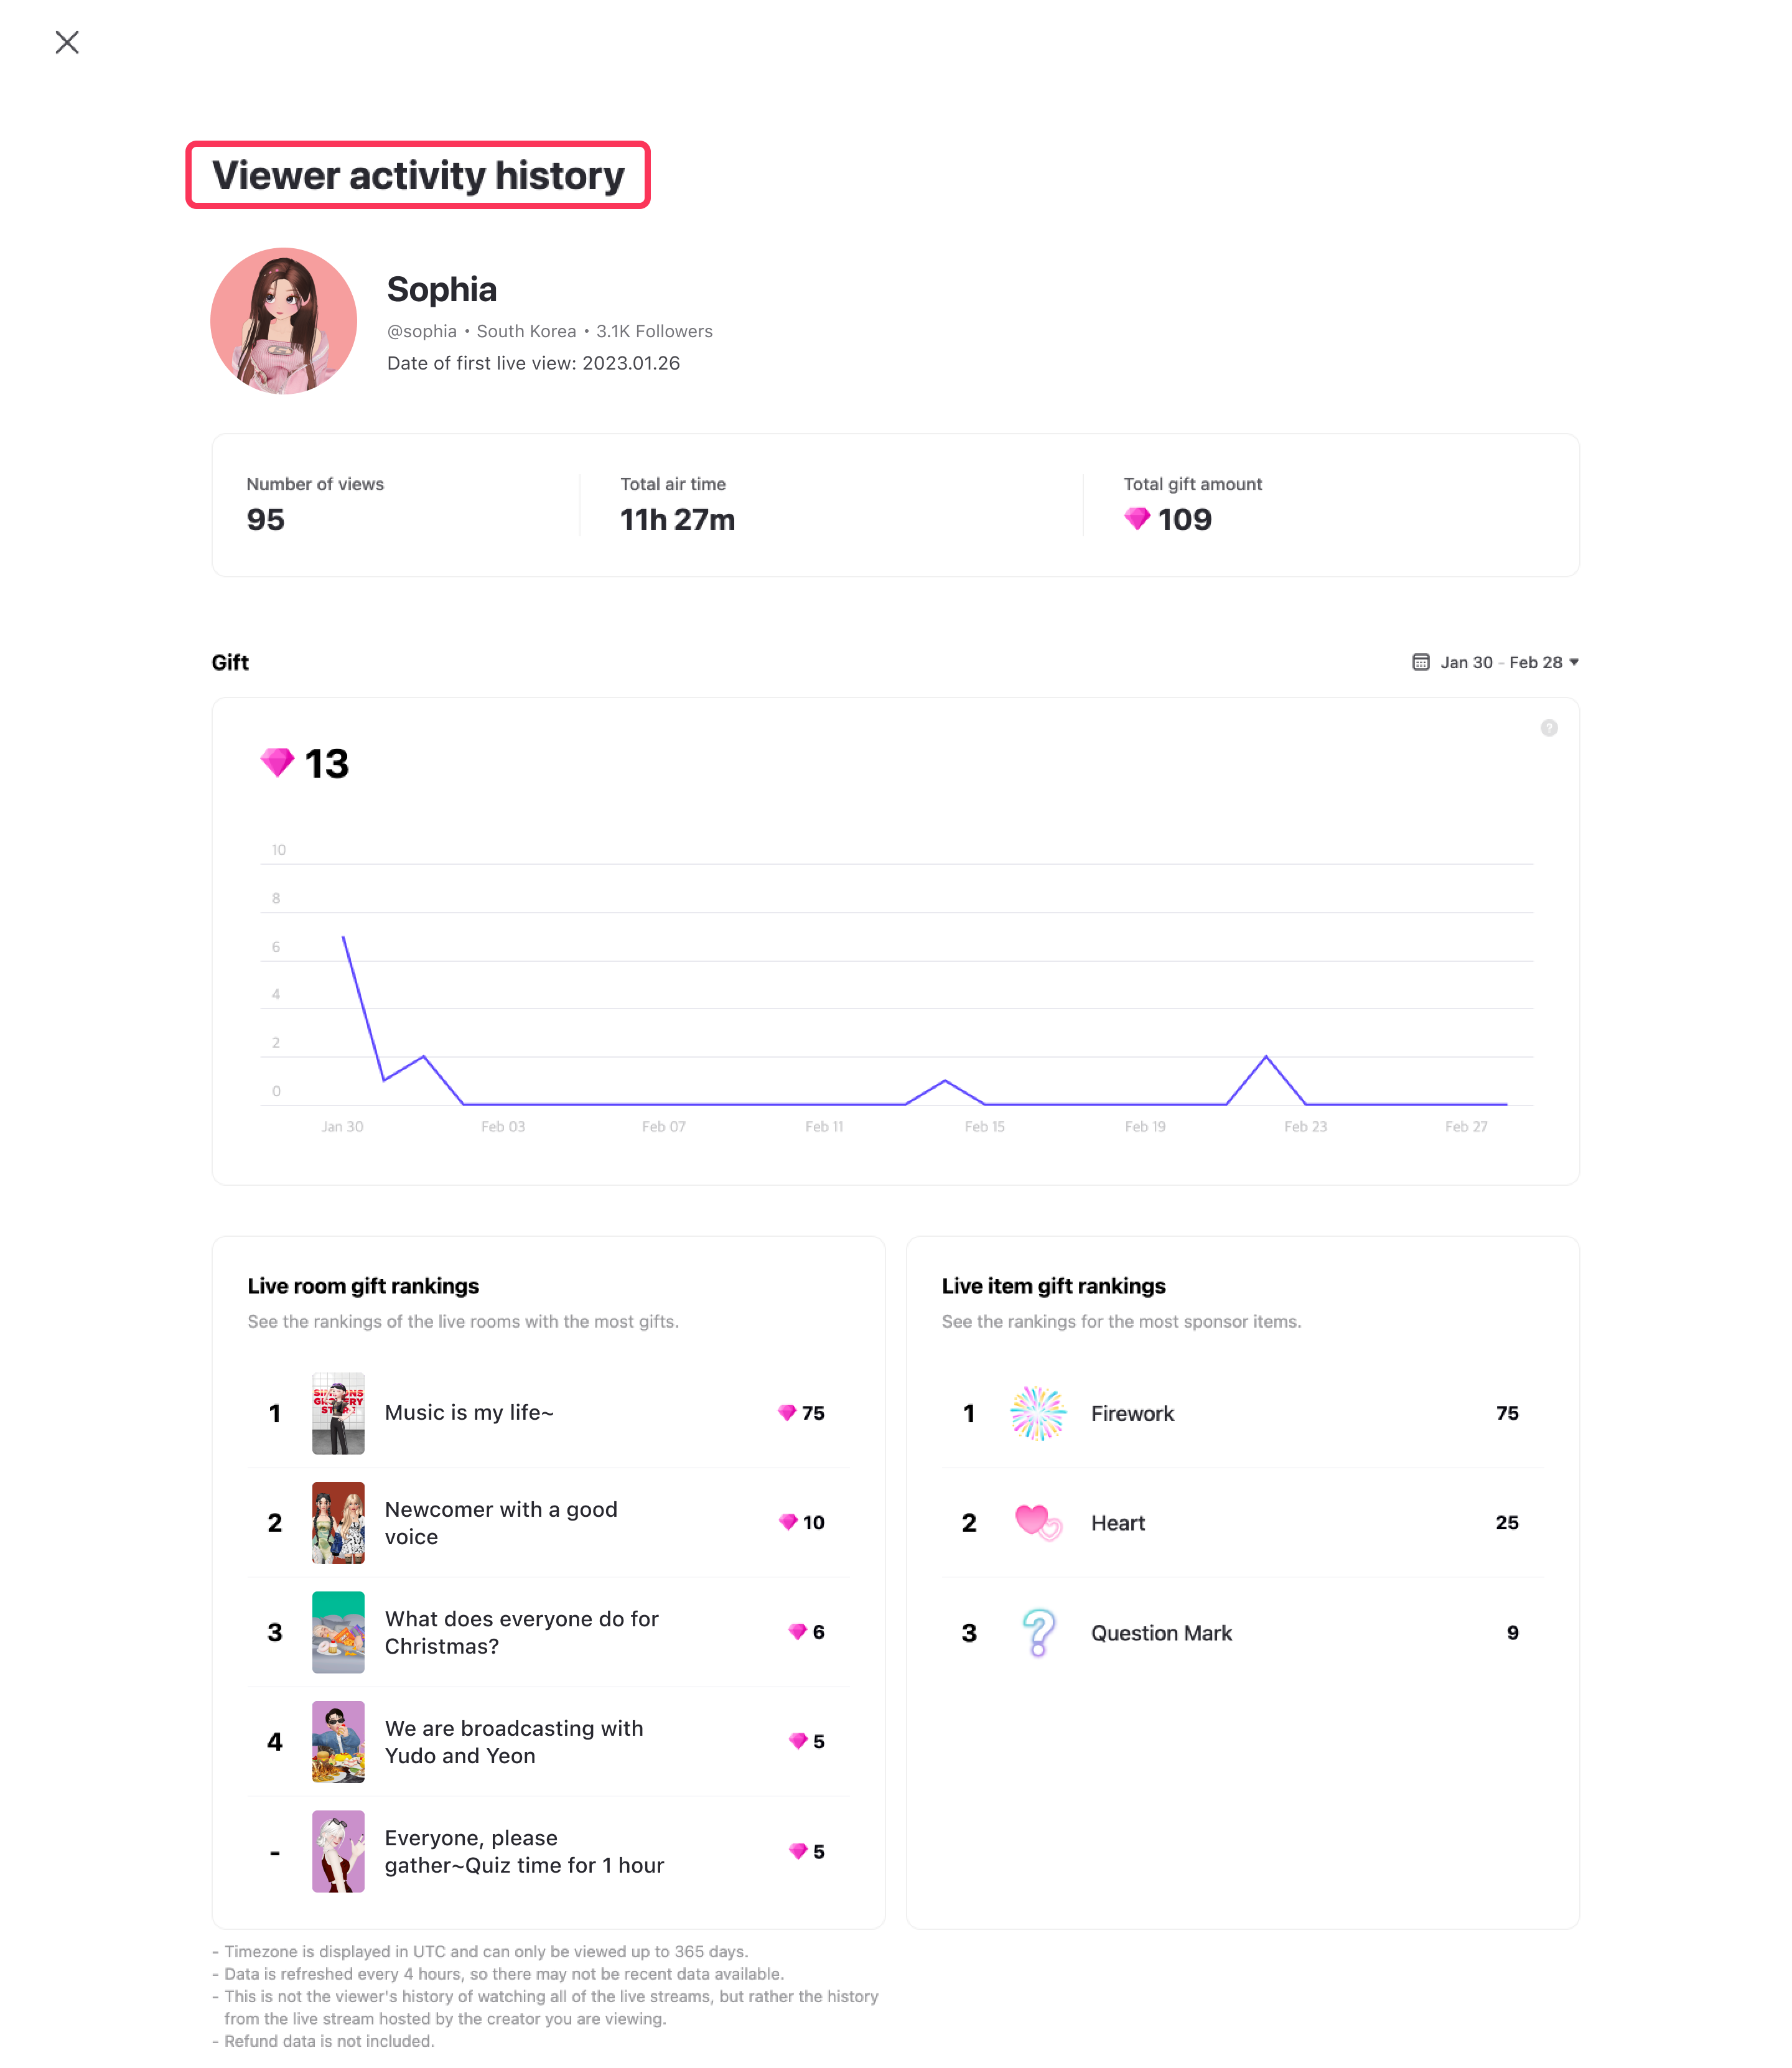
You can see how much ZEM your viewers have gifted to you in a graph, and you can set a timeframe of at least 1 day and up to 365 days.
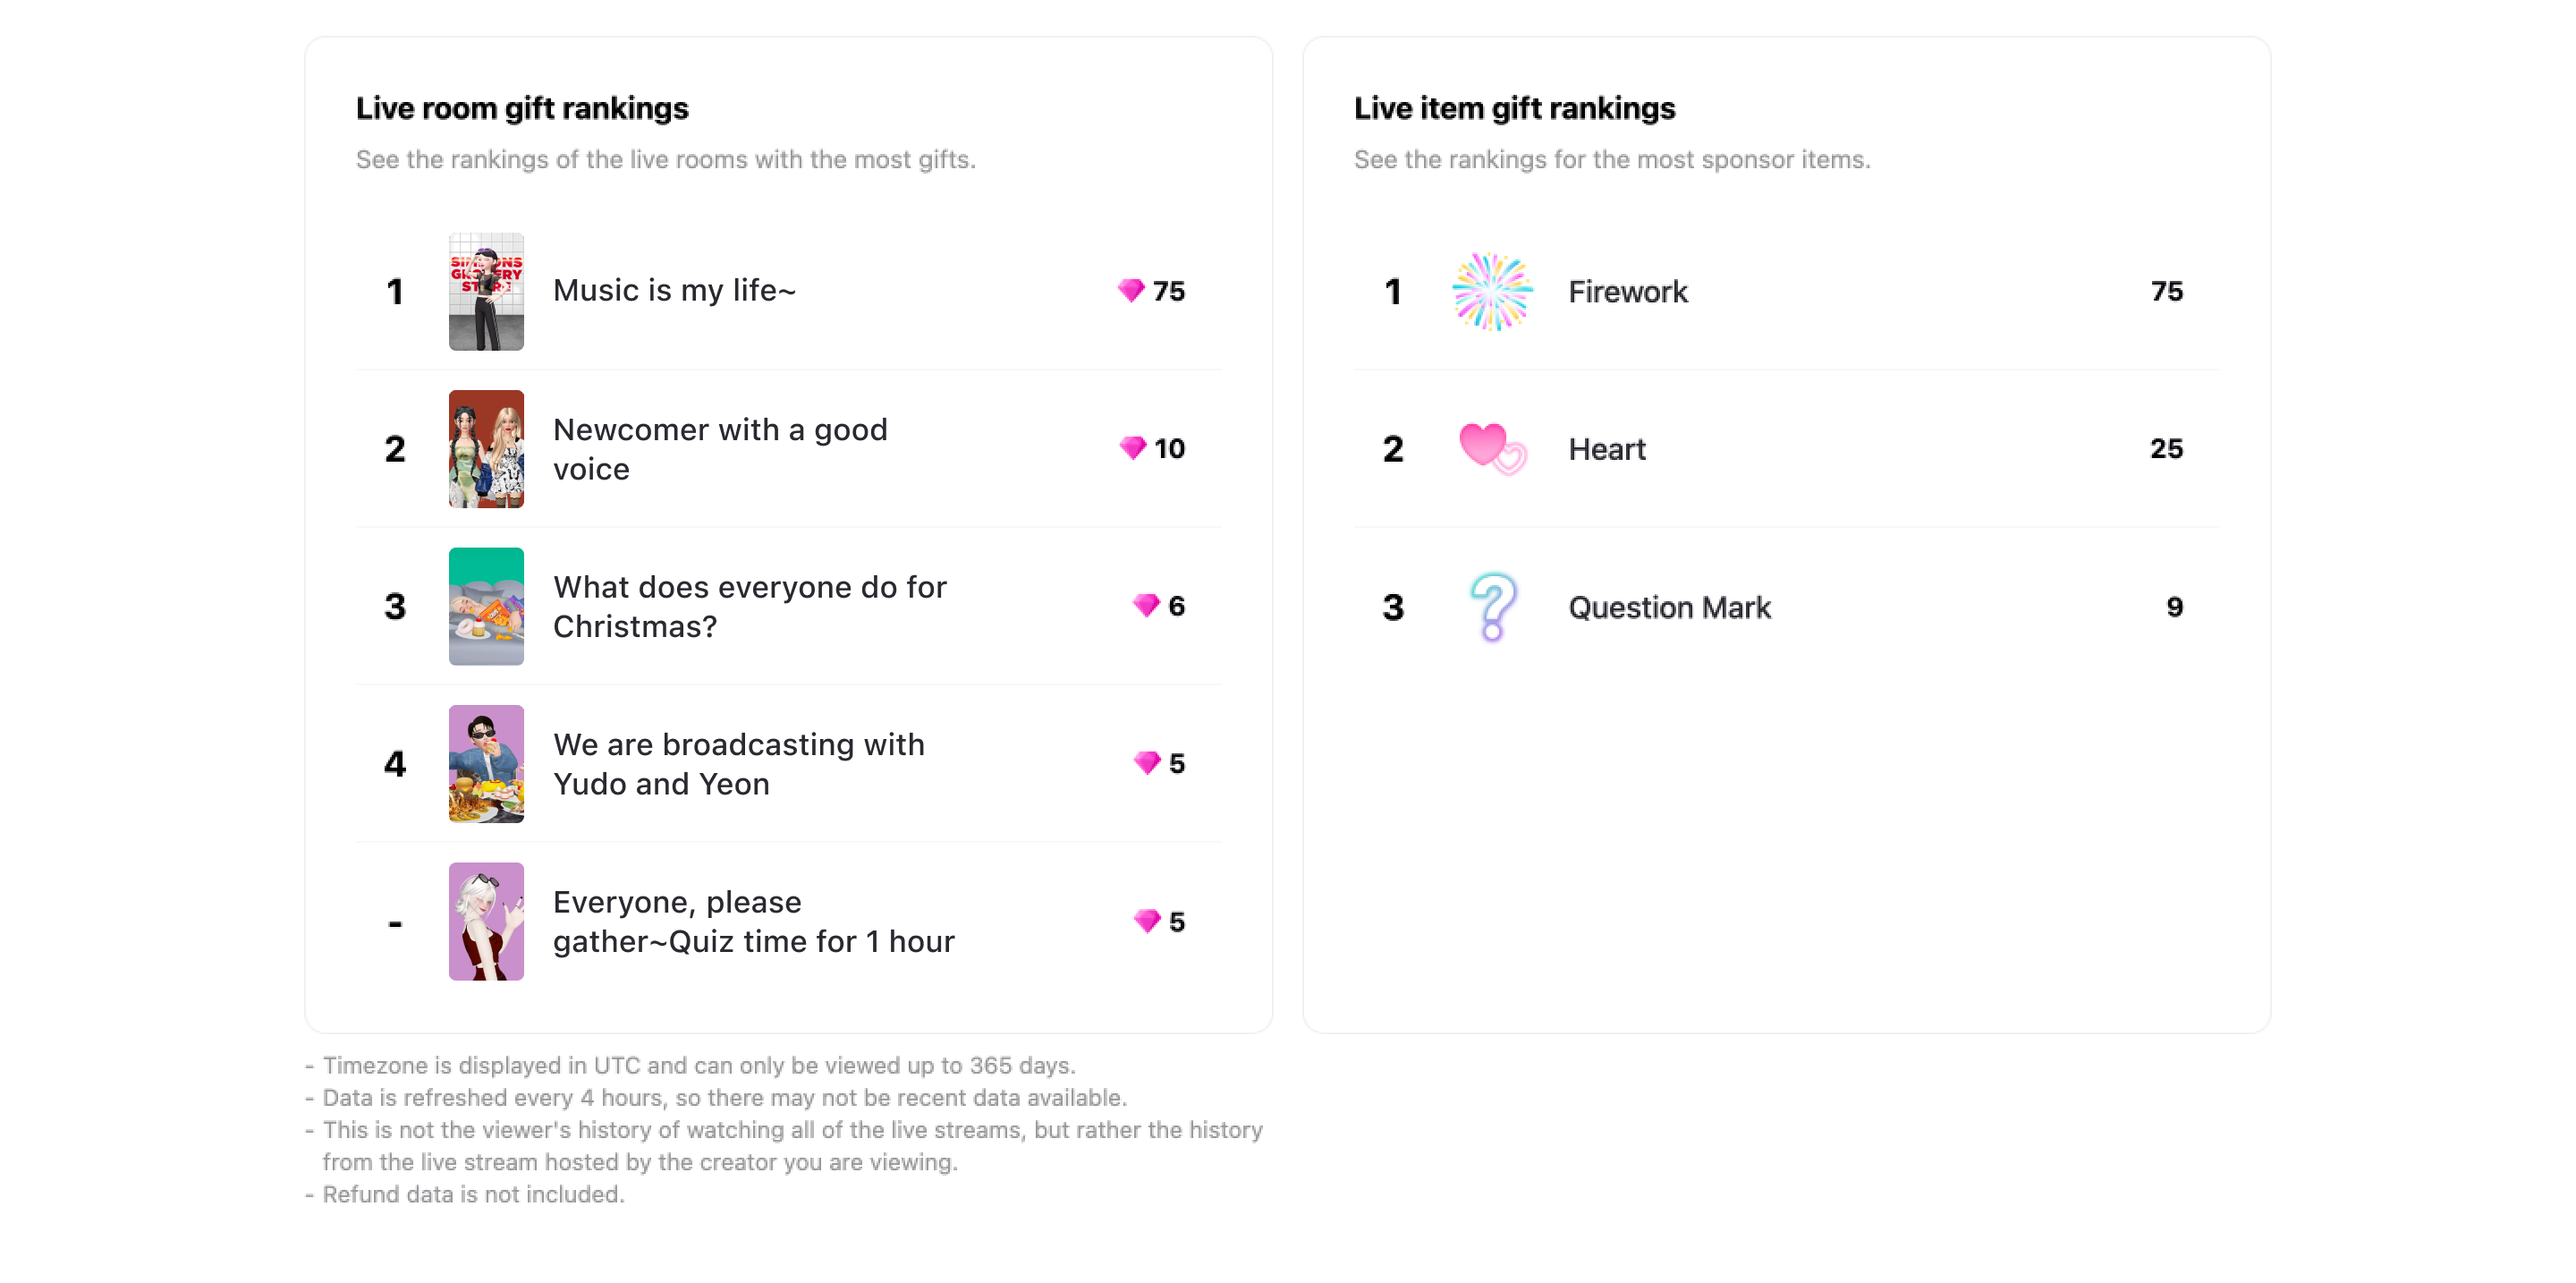
- Supporter Ranking: Top 5 most gifted lives by the specific viewer during the viewing period.
- Live Item Gift Ranking: Top 5 items the specific viewer gifted the most during the viewing period.
The indicators provided in the Viewer activity history may differ from the values used in the actual profit withdrawal.
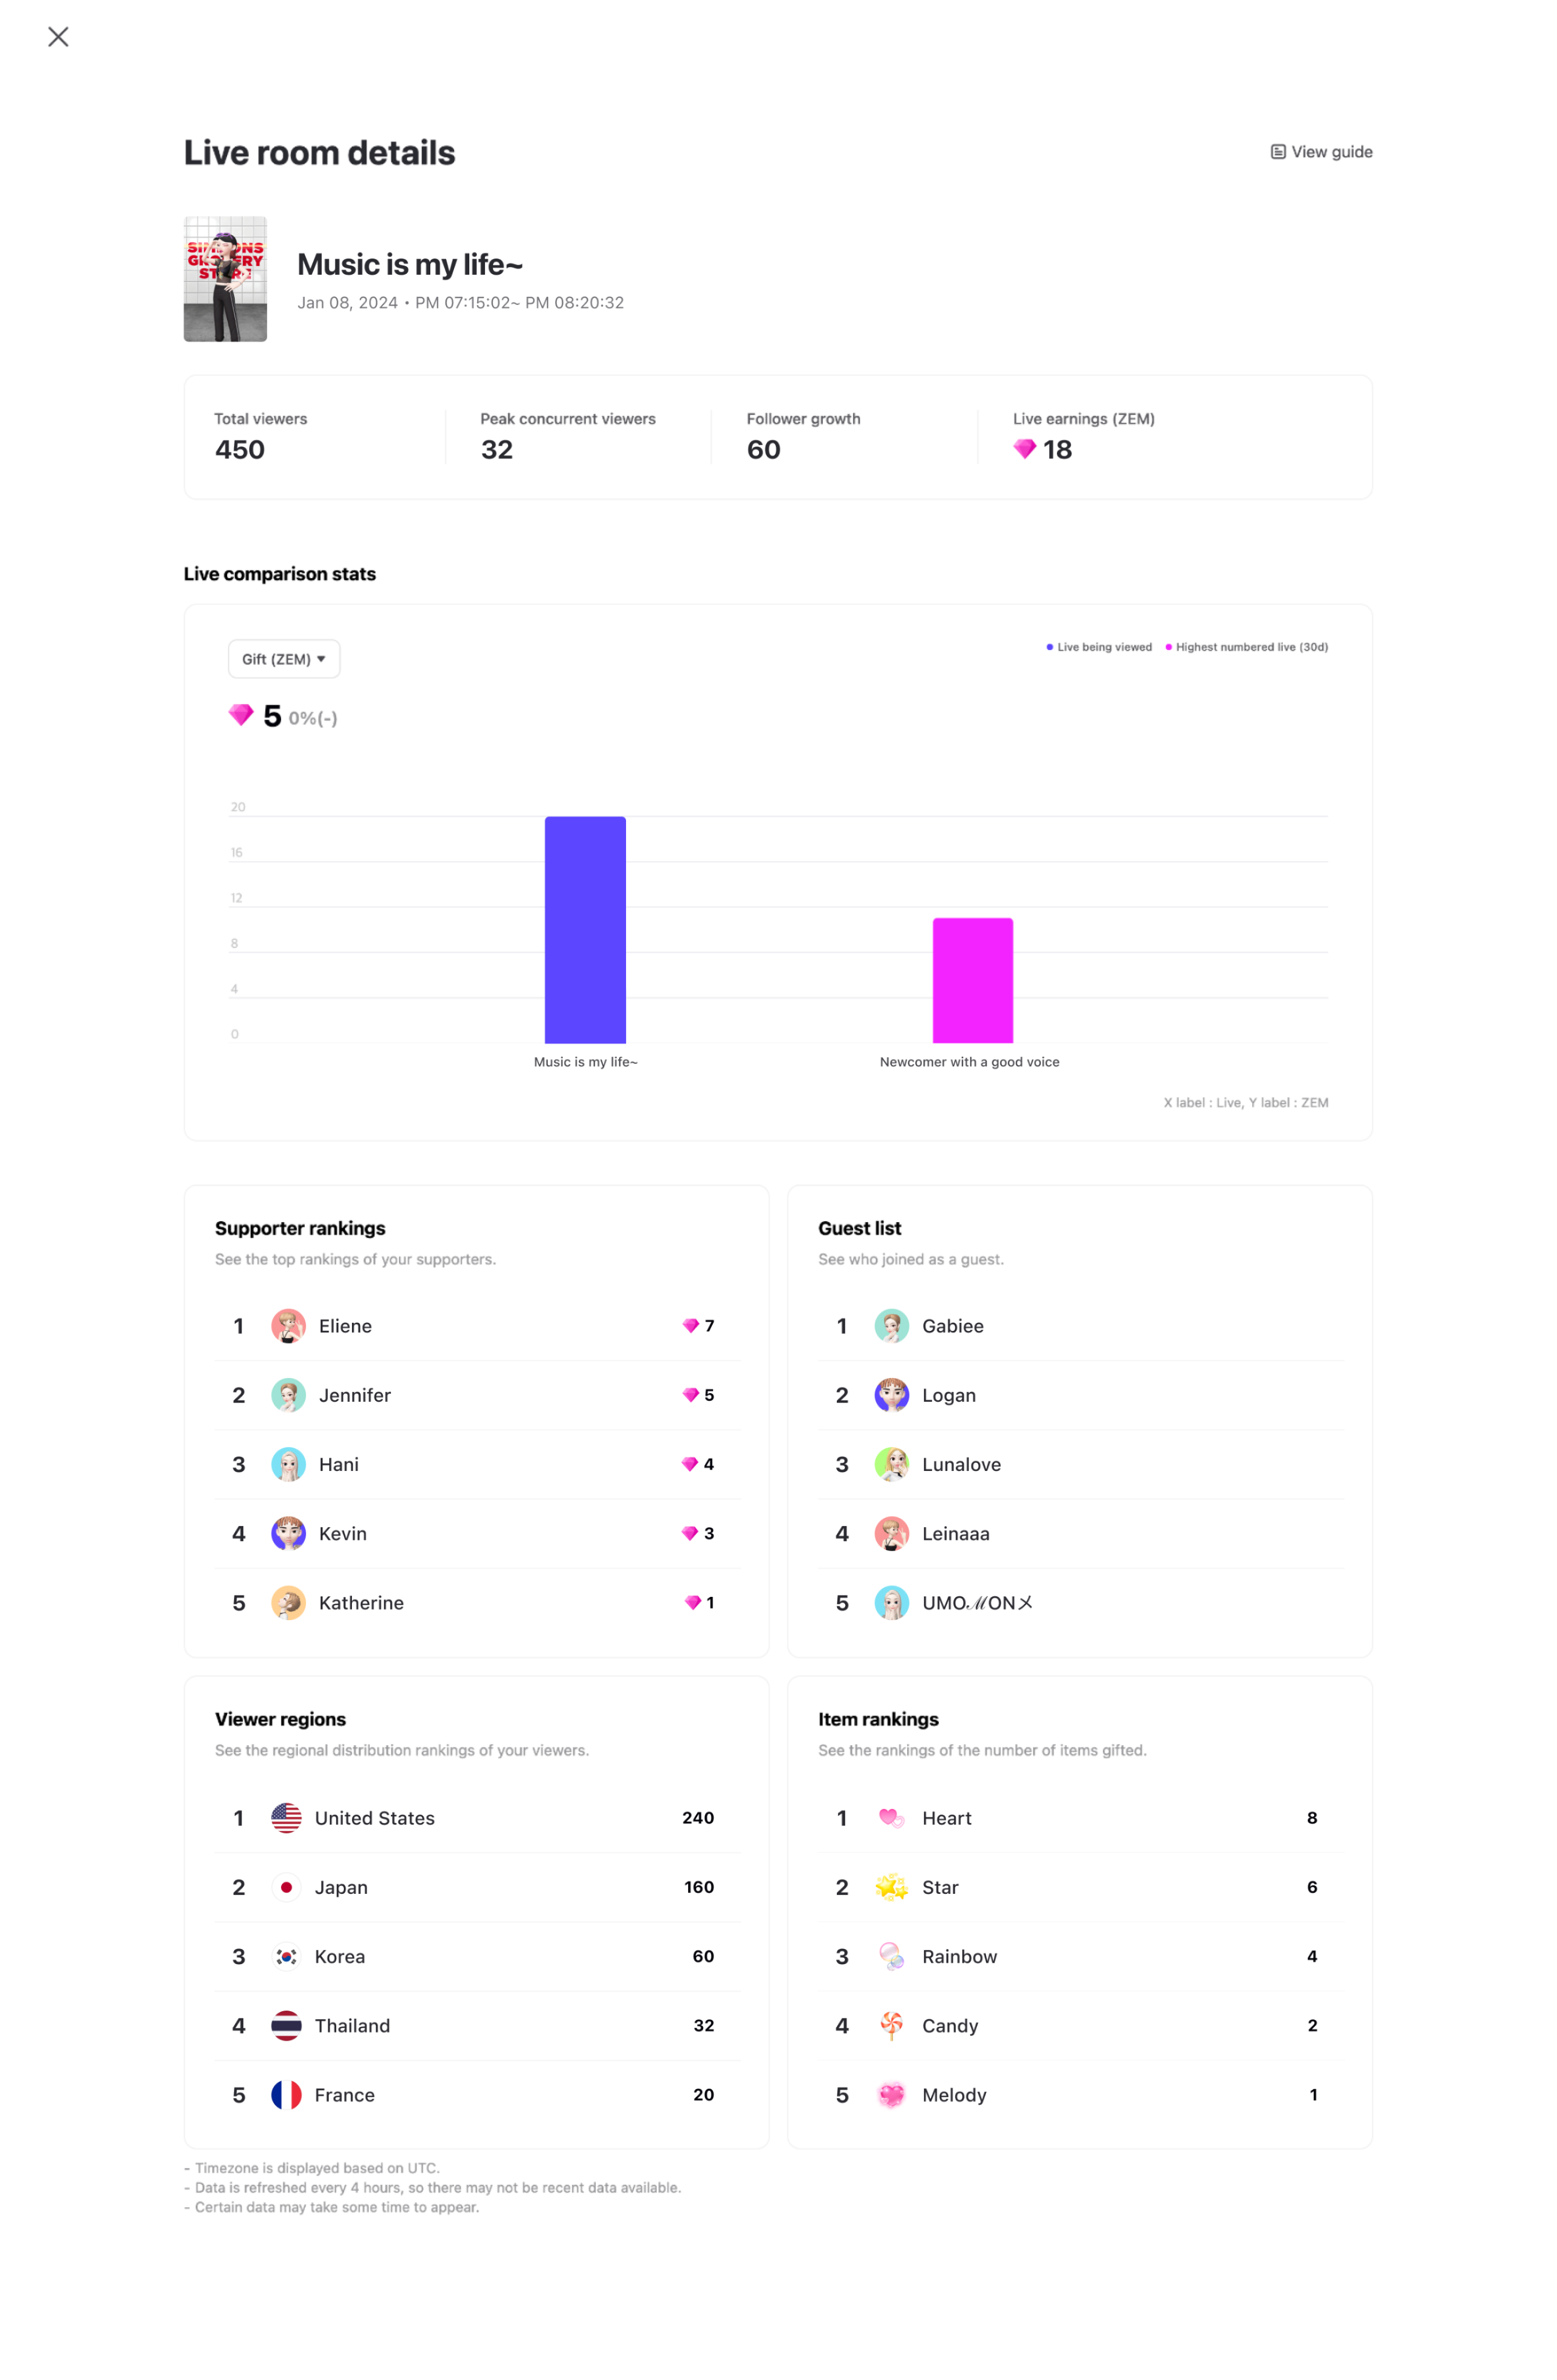
Live Room Details
In Live Rankings with high viewership and those with high support, you can click the live name to view the detailed page of the live room. Note that the number of followers may vary due to unfollowers.
- Total Viewers: Total number of viewers who entered the live room.
- Peak Concurrent Viewers: The highest number of simultaneous viewers during your live.
- Follower Gain: Number of followers gained from the live.
- Live Revenue (ZEM): Total amount of gifts earned in the live room.
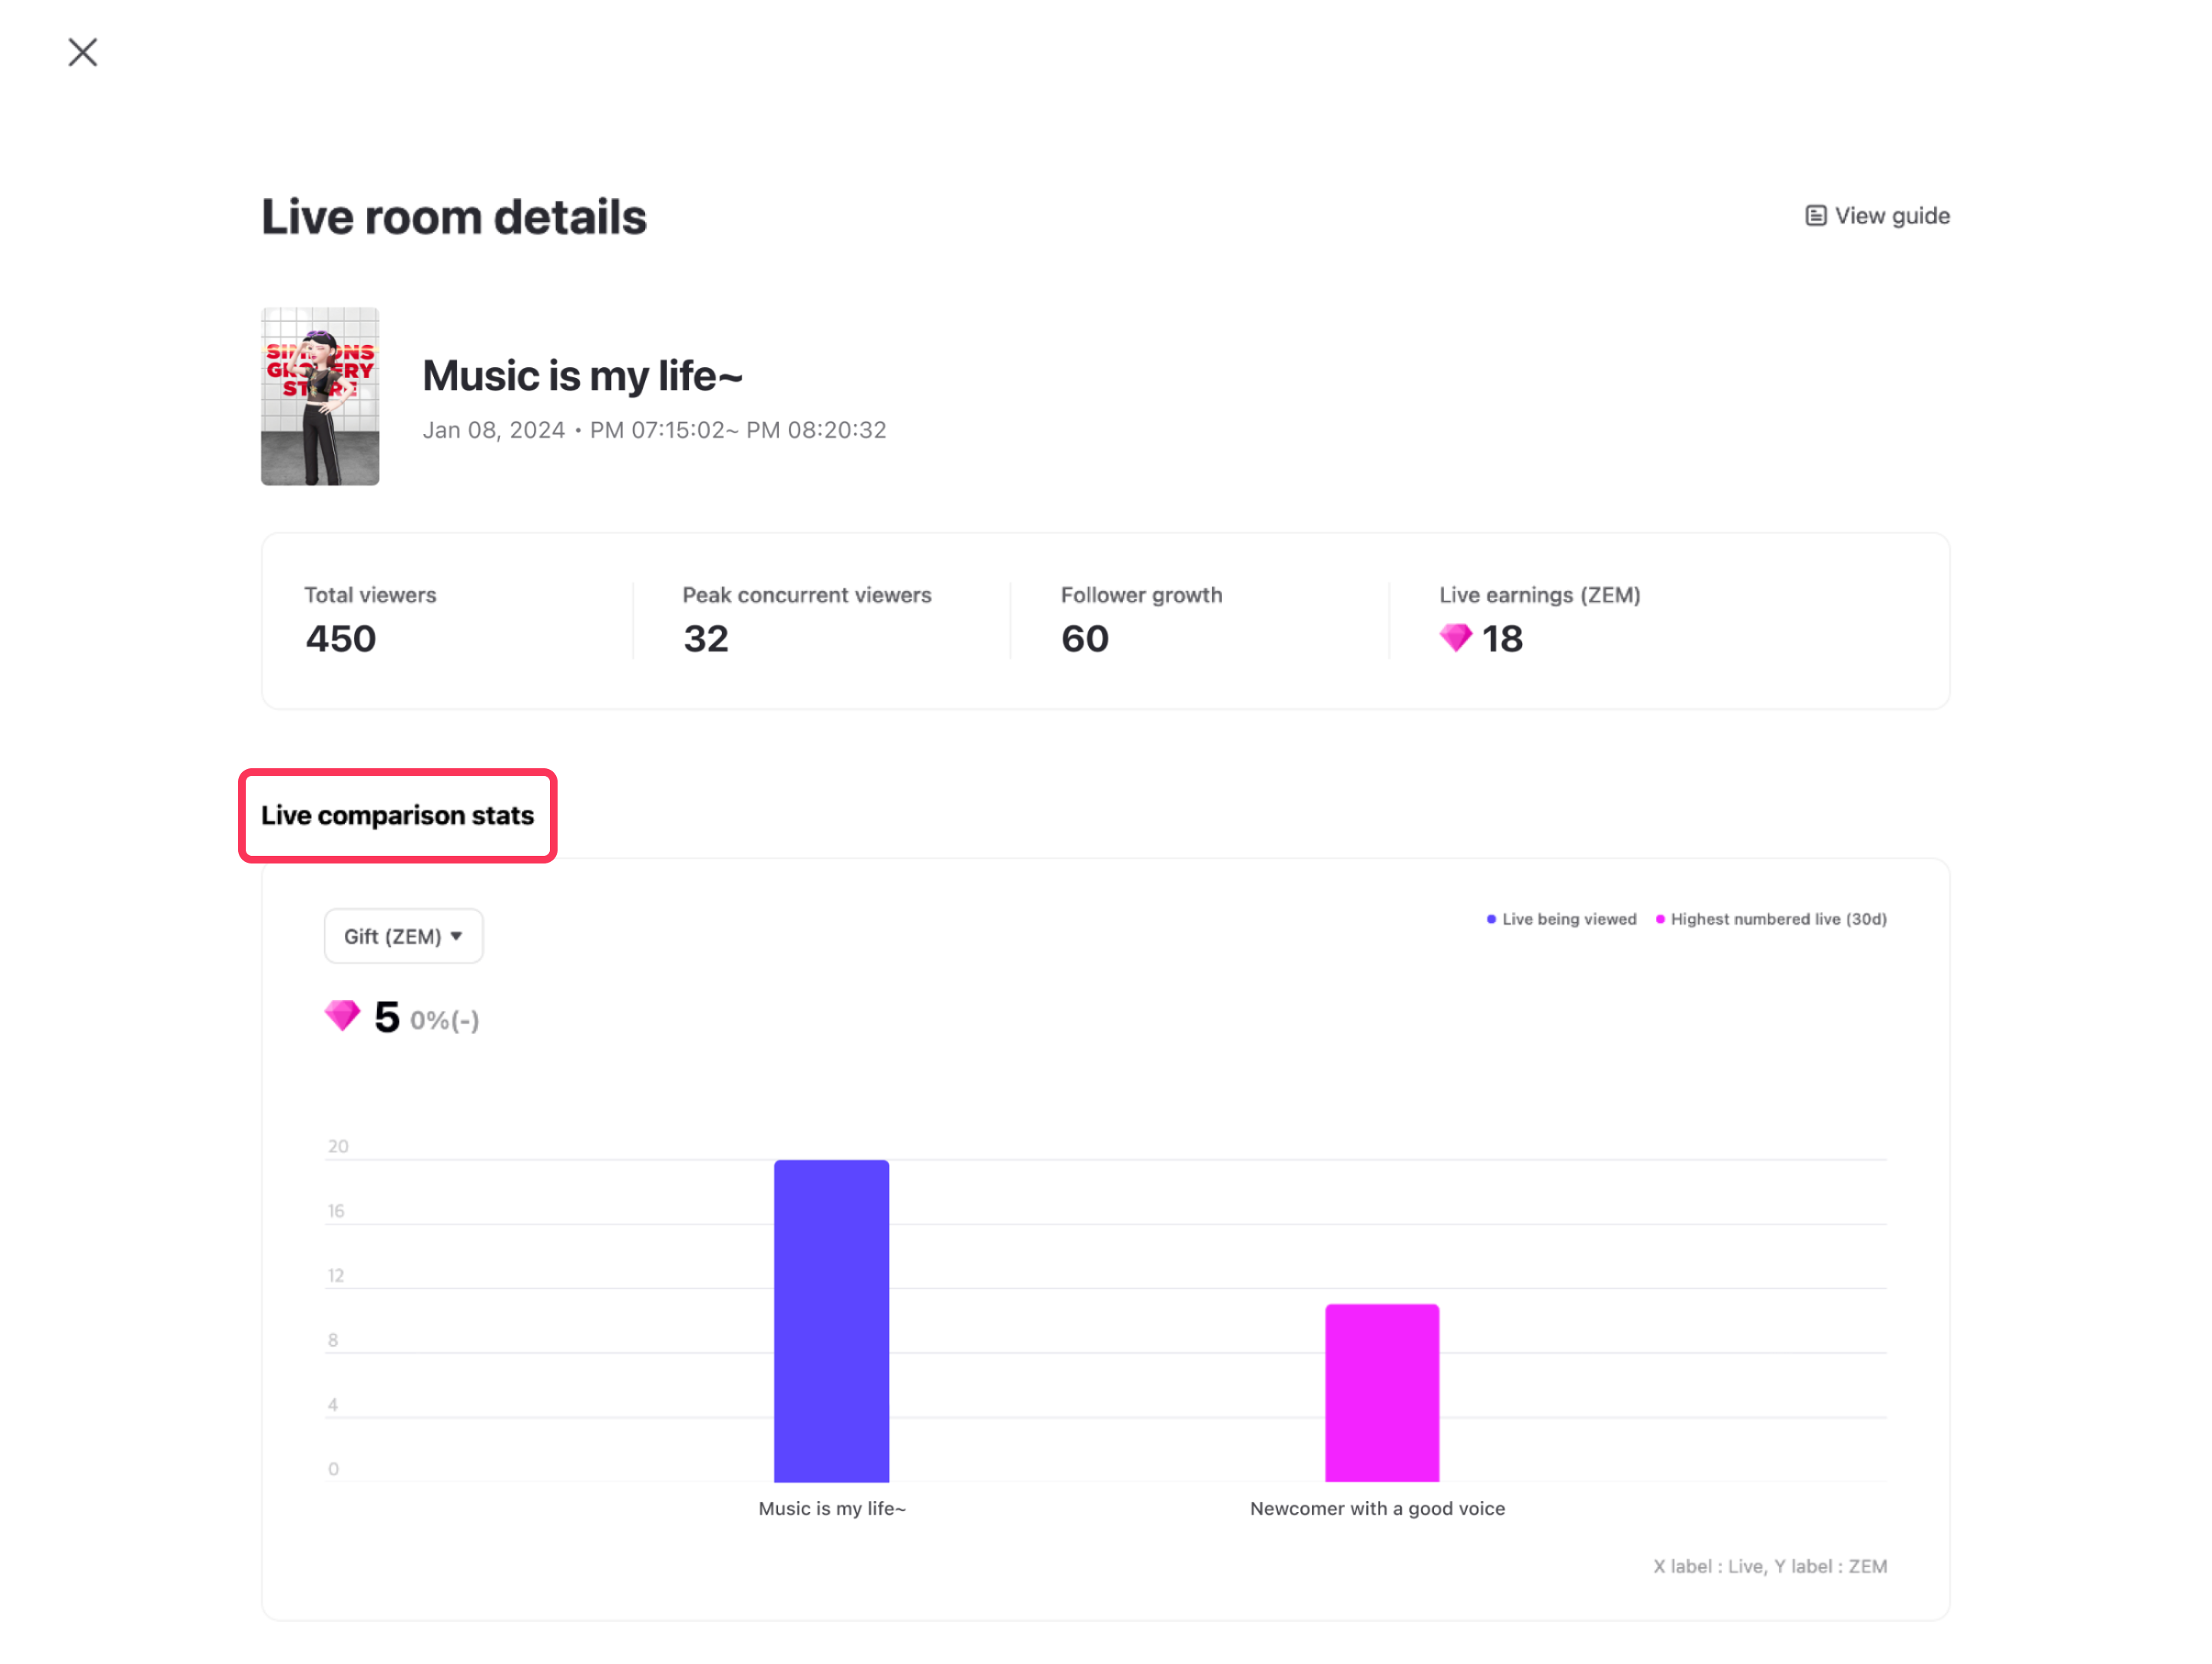
After the live ends, you can view the following statistical data.
- Sales: Total number of ZEMs earned through gifts from live.
- Viewers: Total number of viewers who joined the live.
- Followers: Number of followers gained from the live.
- Dwell Time: Time spent per viewer on the live.
You can view a comparison of the live that you viewed, the live with the highest numbers, and the live with the average numbers.
The indicators provided in the Viewer activity history may differ from the values used in the actual profit withdrawal.
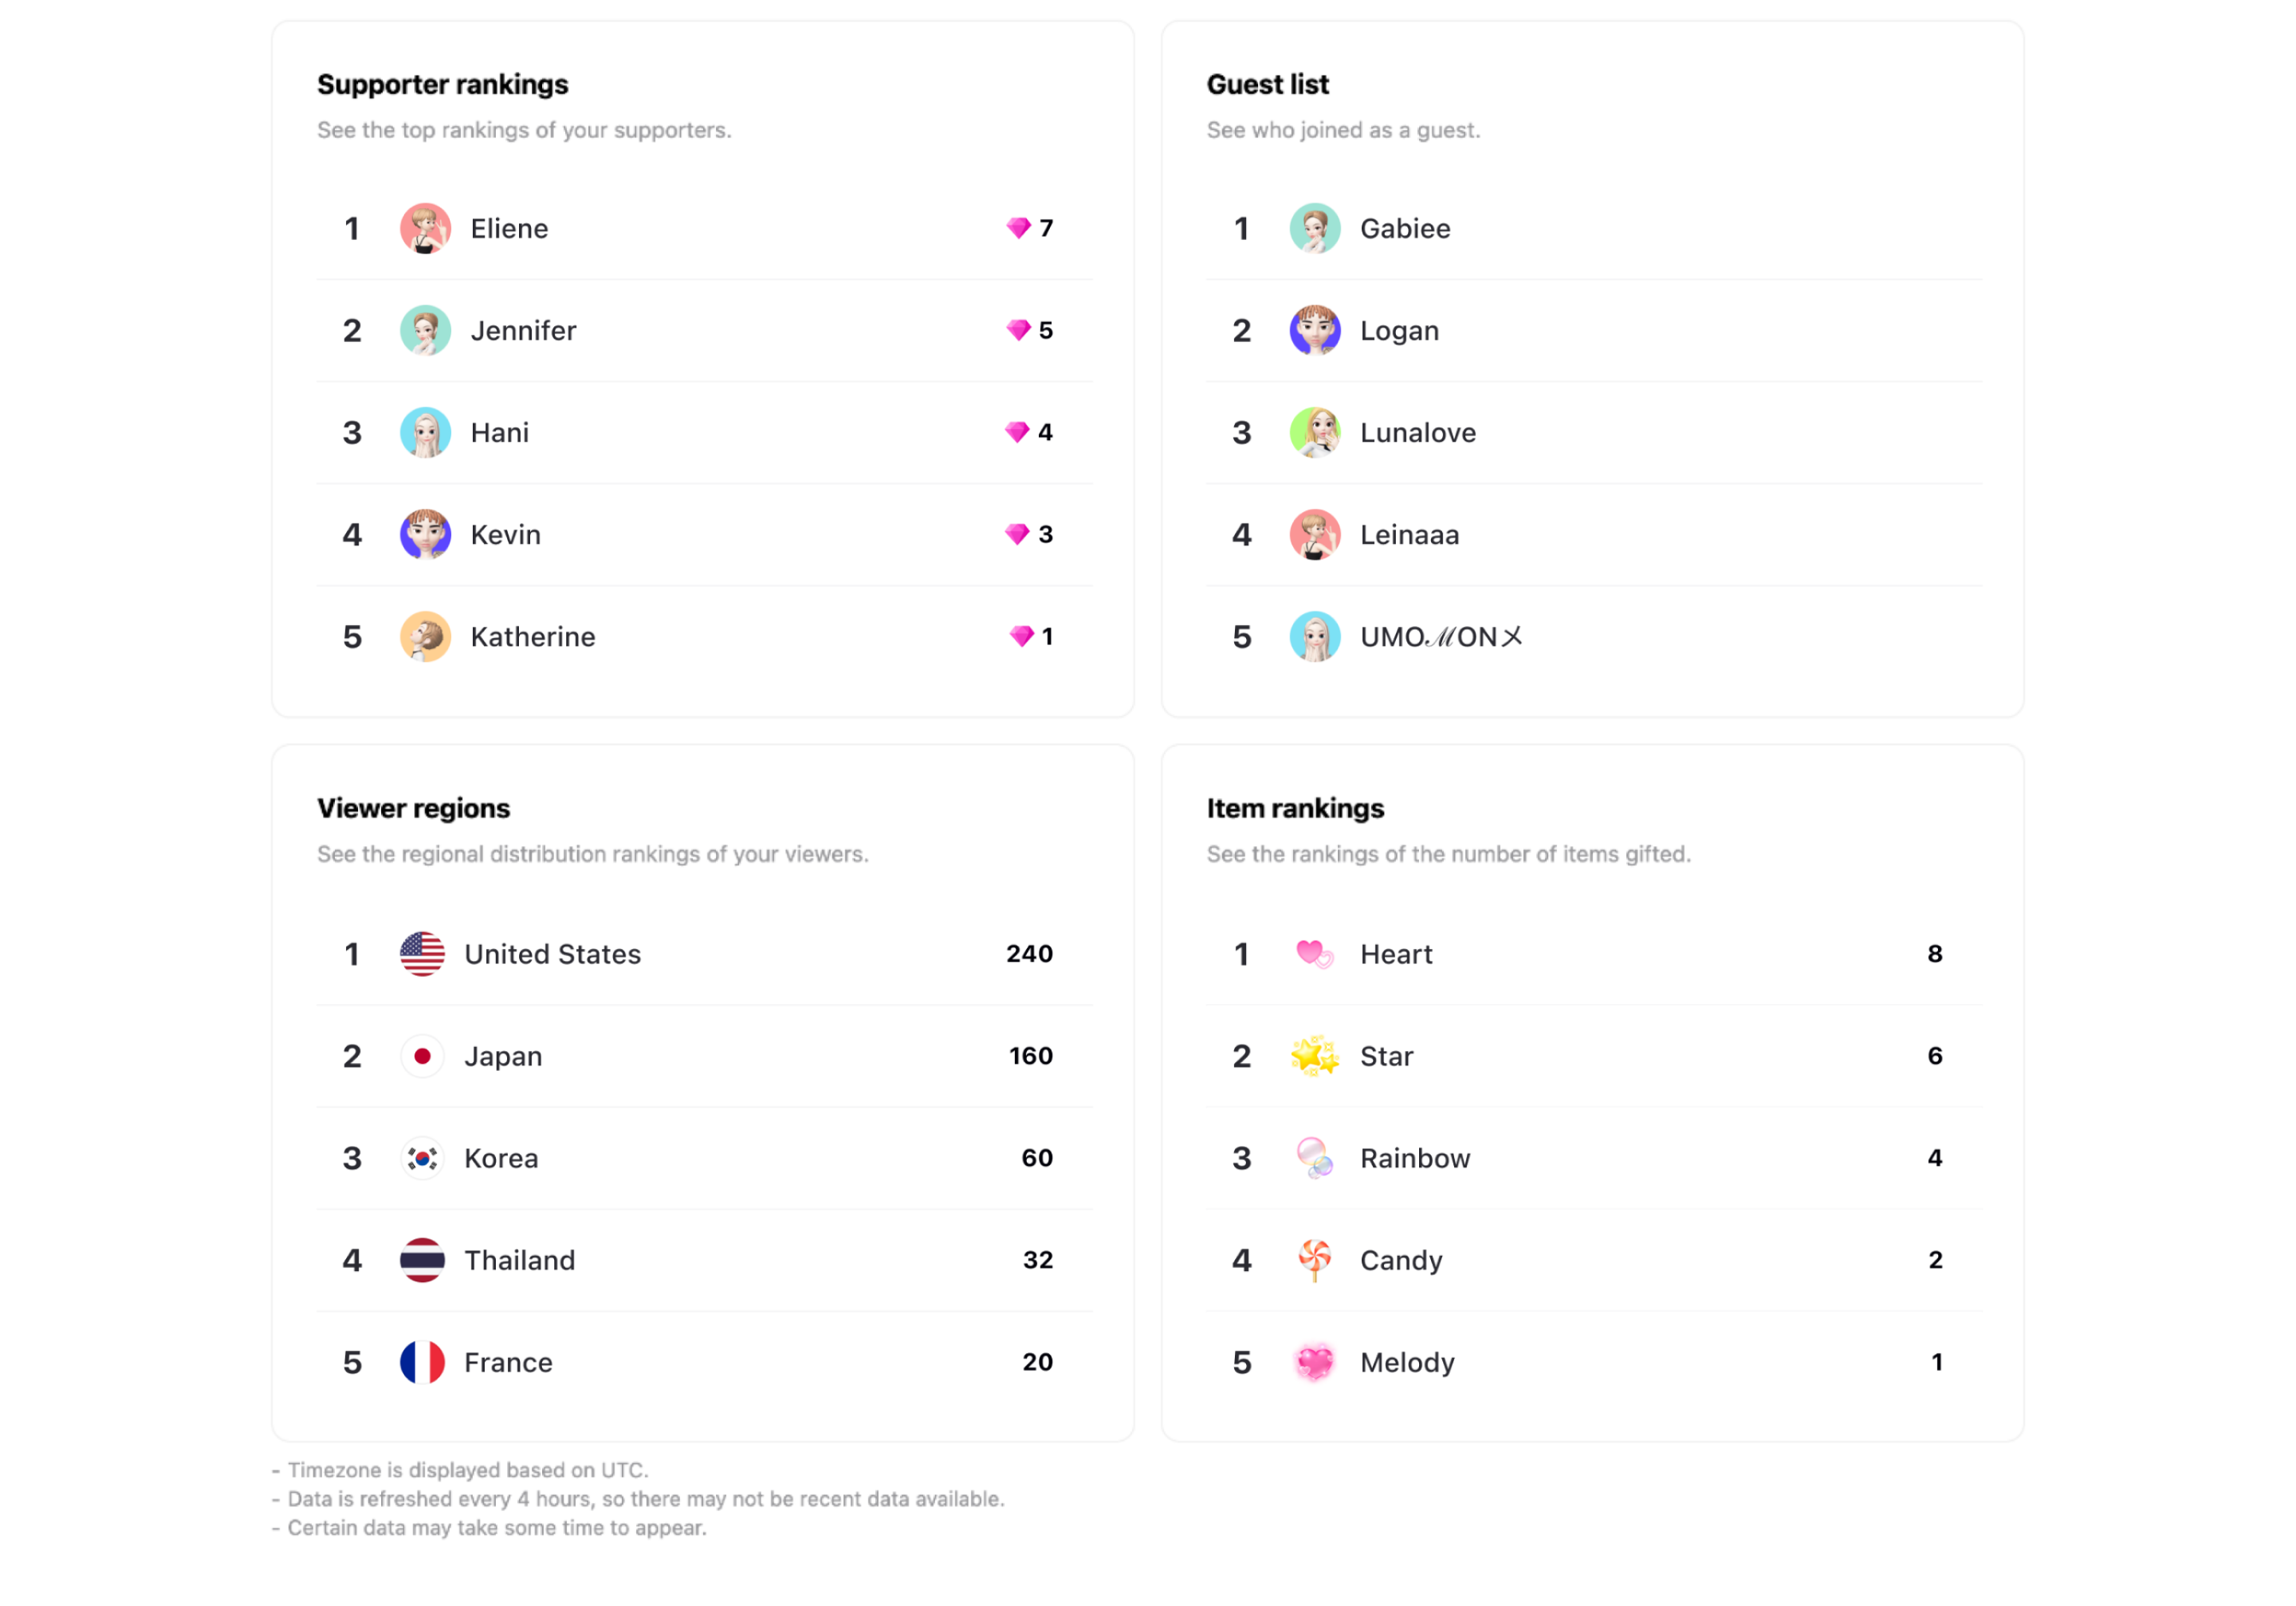
- Supporter Ranking: Viewers who have gifted the most on live.
- Guest List: Guests who joined the live.
- Viewer Countries: Countries that watched your live the most.
- Item Ranking: Number of gifted items sold in the live.
Updated 5 months ago