ZEPETOScript uses Microsoft Visual Studio code and JetBrains Rider tools to help with debugging.
Editors
- Microsoft Visual Studio code : https://code.visualstudio.com/
- JetBrains Rider : https://www.jetbrains.com/rider/
The following guide was prepared using Visual Studio Code.
Importing Visual Studio to Unity Editor
When the Visual Studio Code installation is complete, open Unity editor and go to the External Tools tab under Unity menu → Edit → Preference.
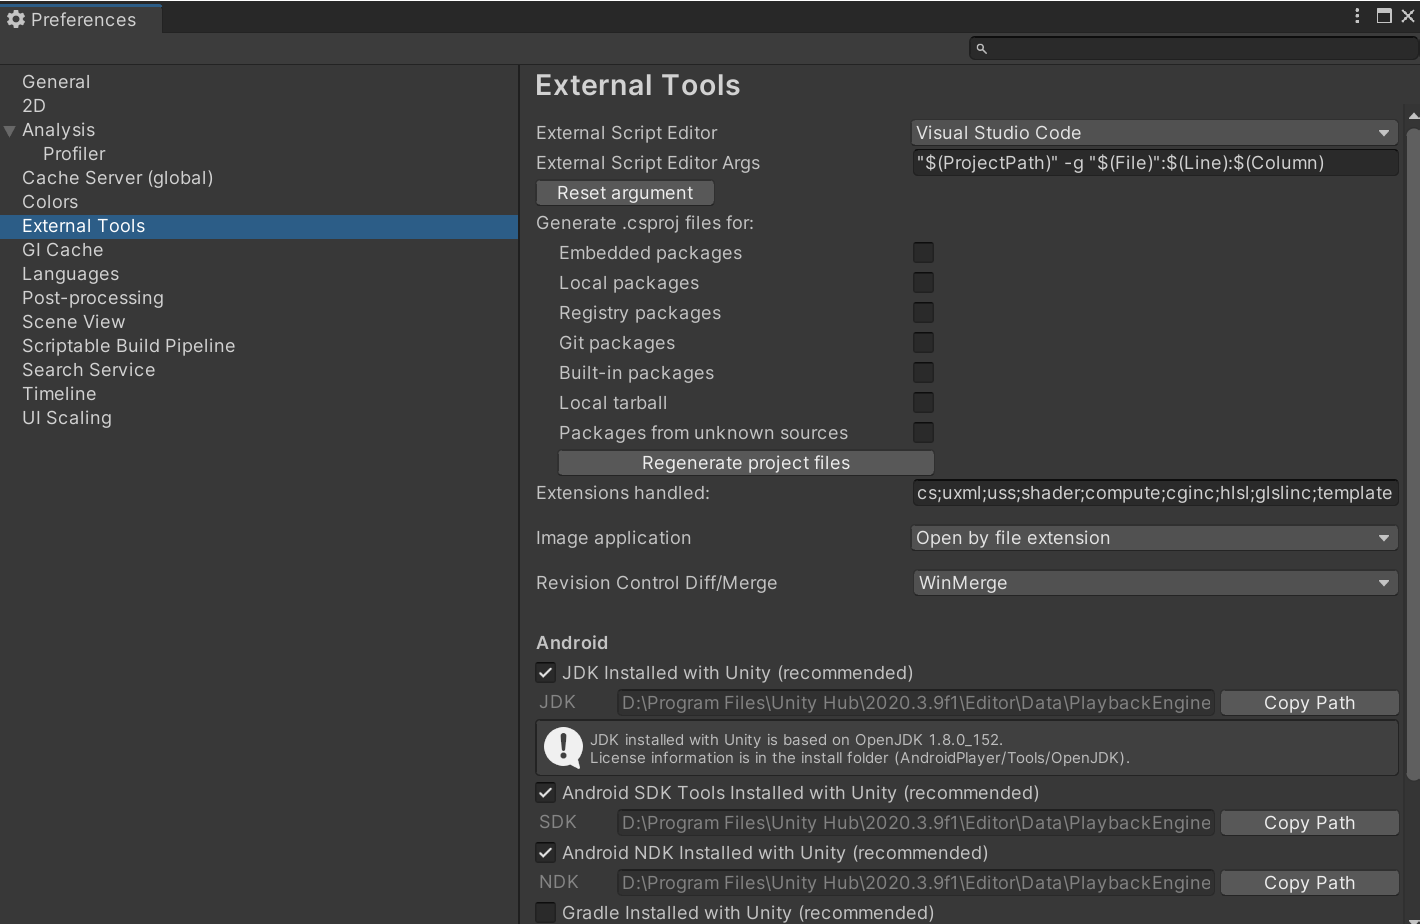
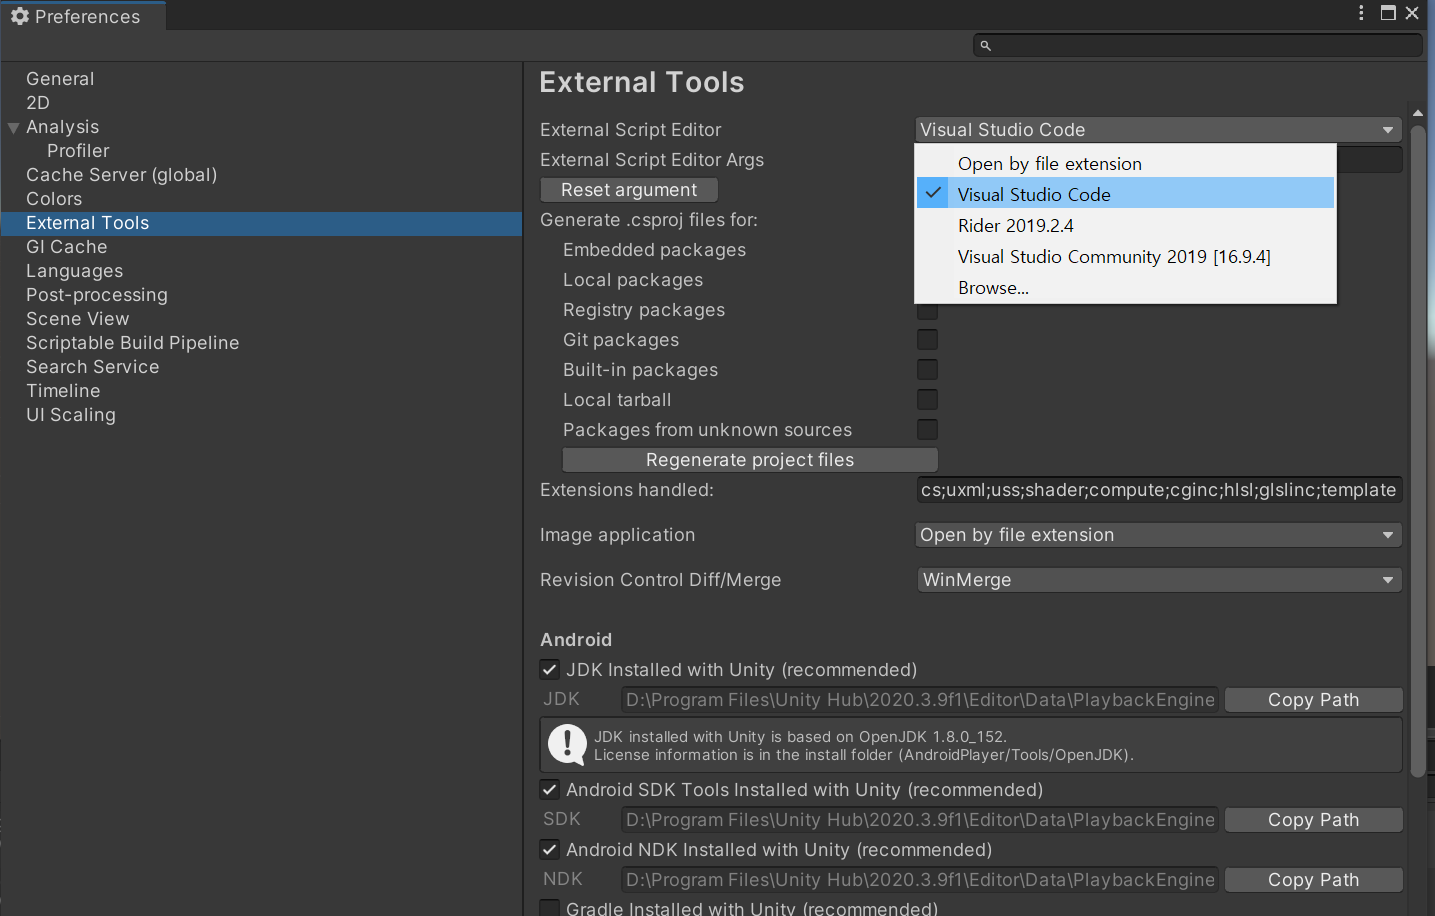
Select Visual Studio Code on External Script Editor.
Debugging in Visual Studio
In the Visual Script Code, add Break points to the ZEPETO Script code line you want to debug.
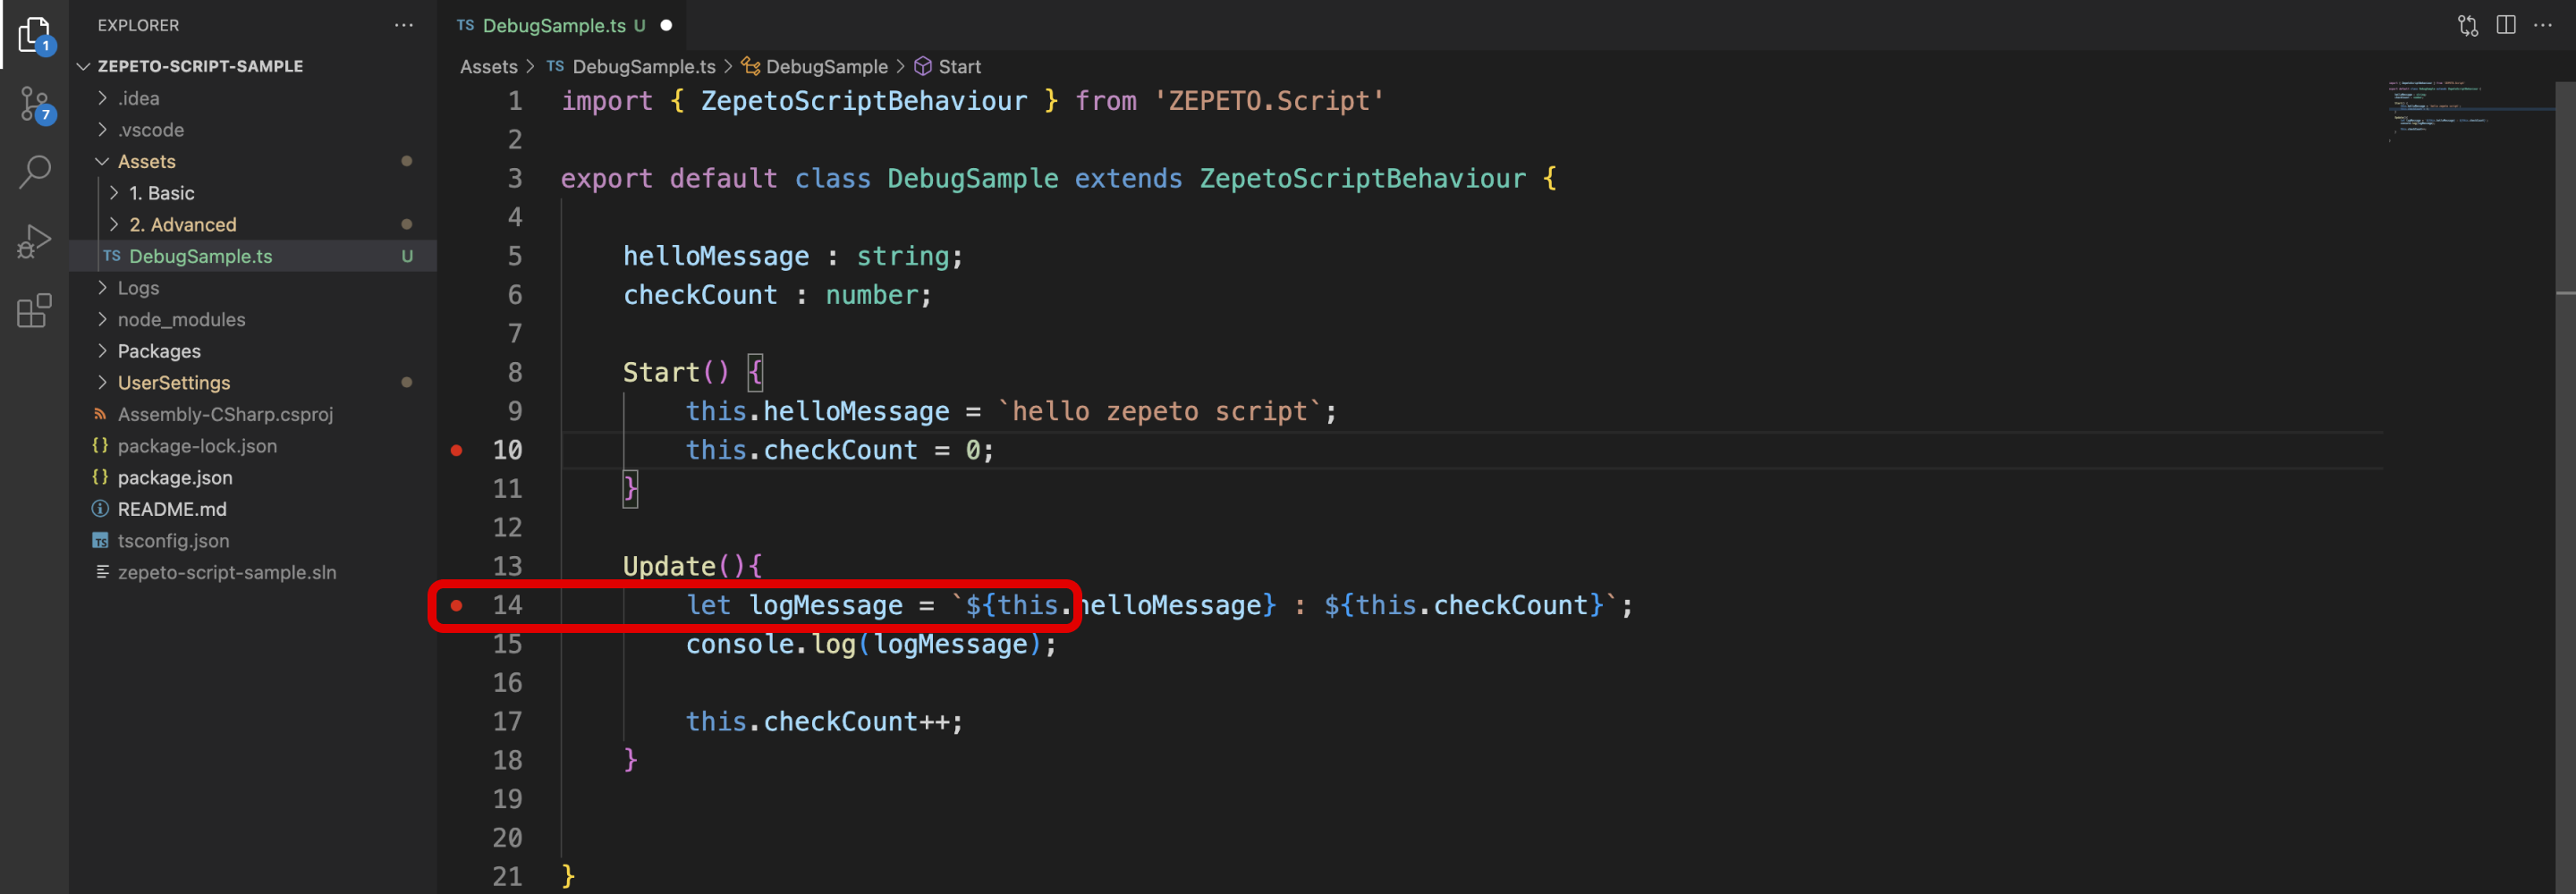
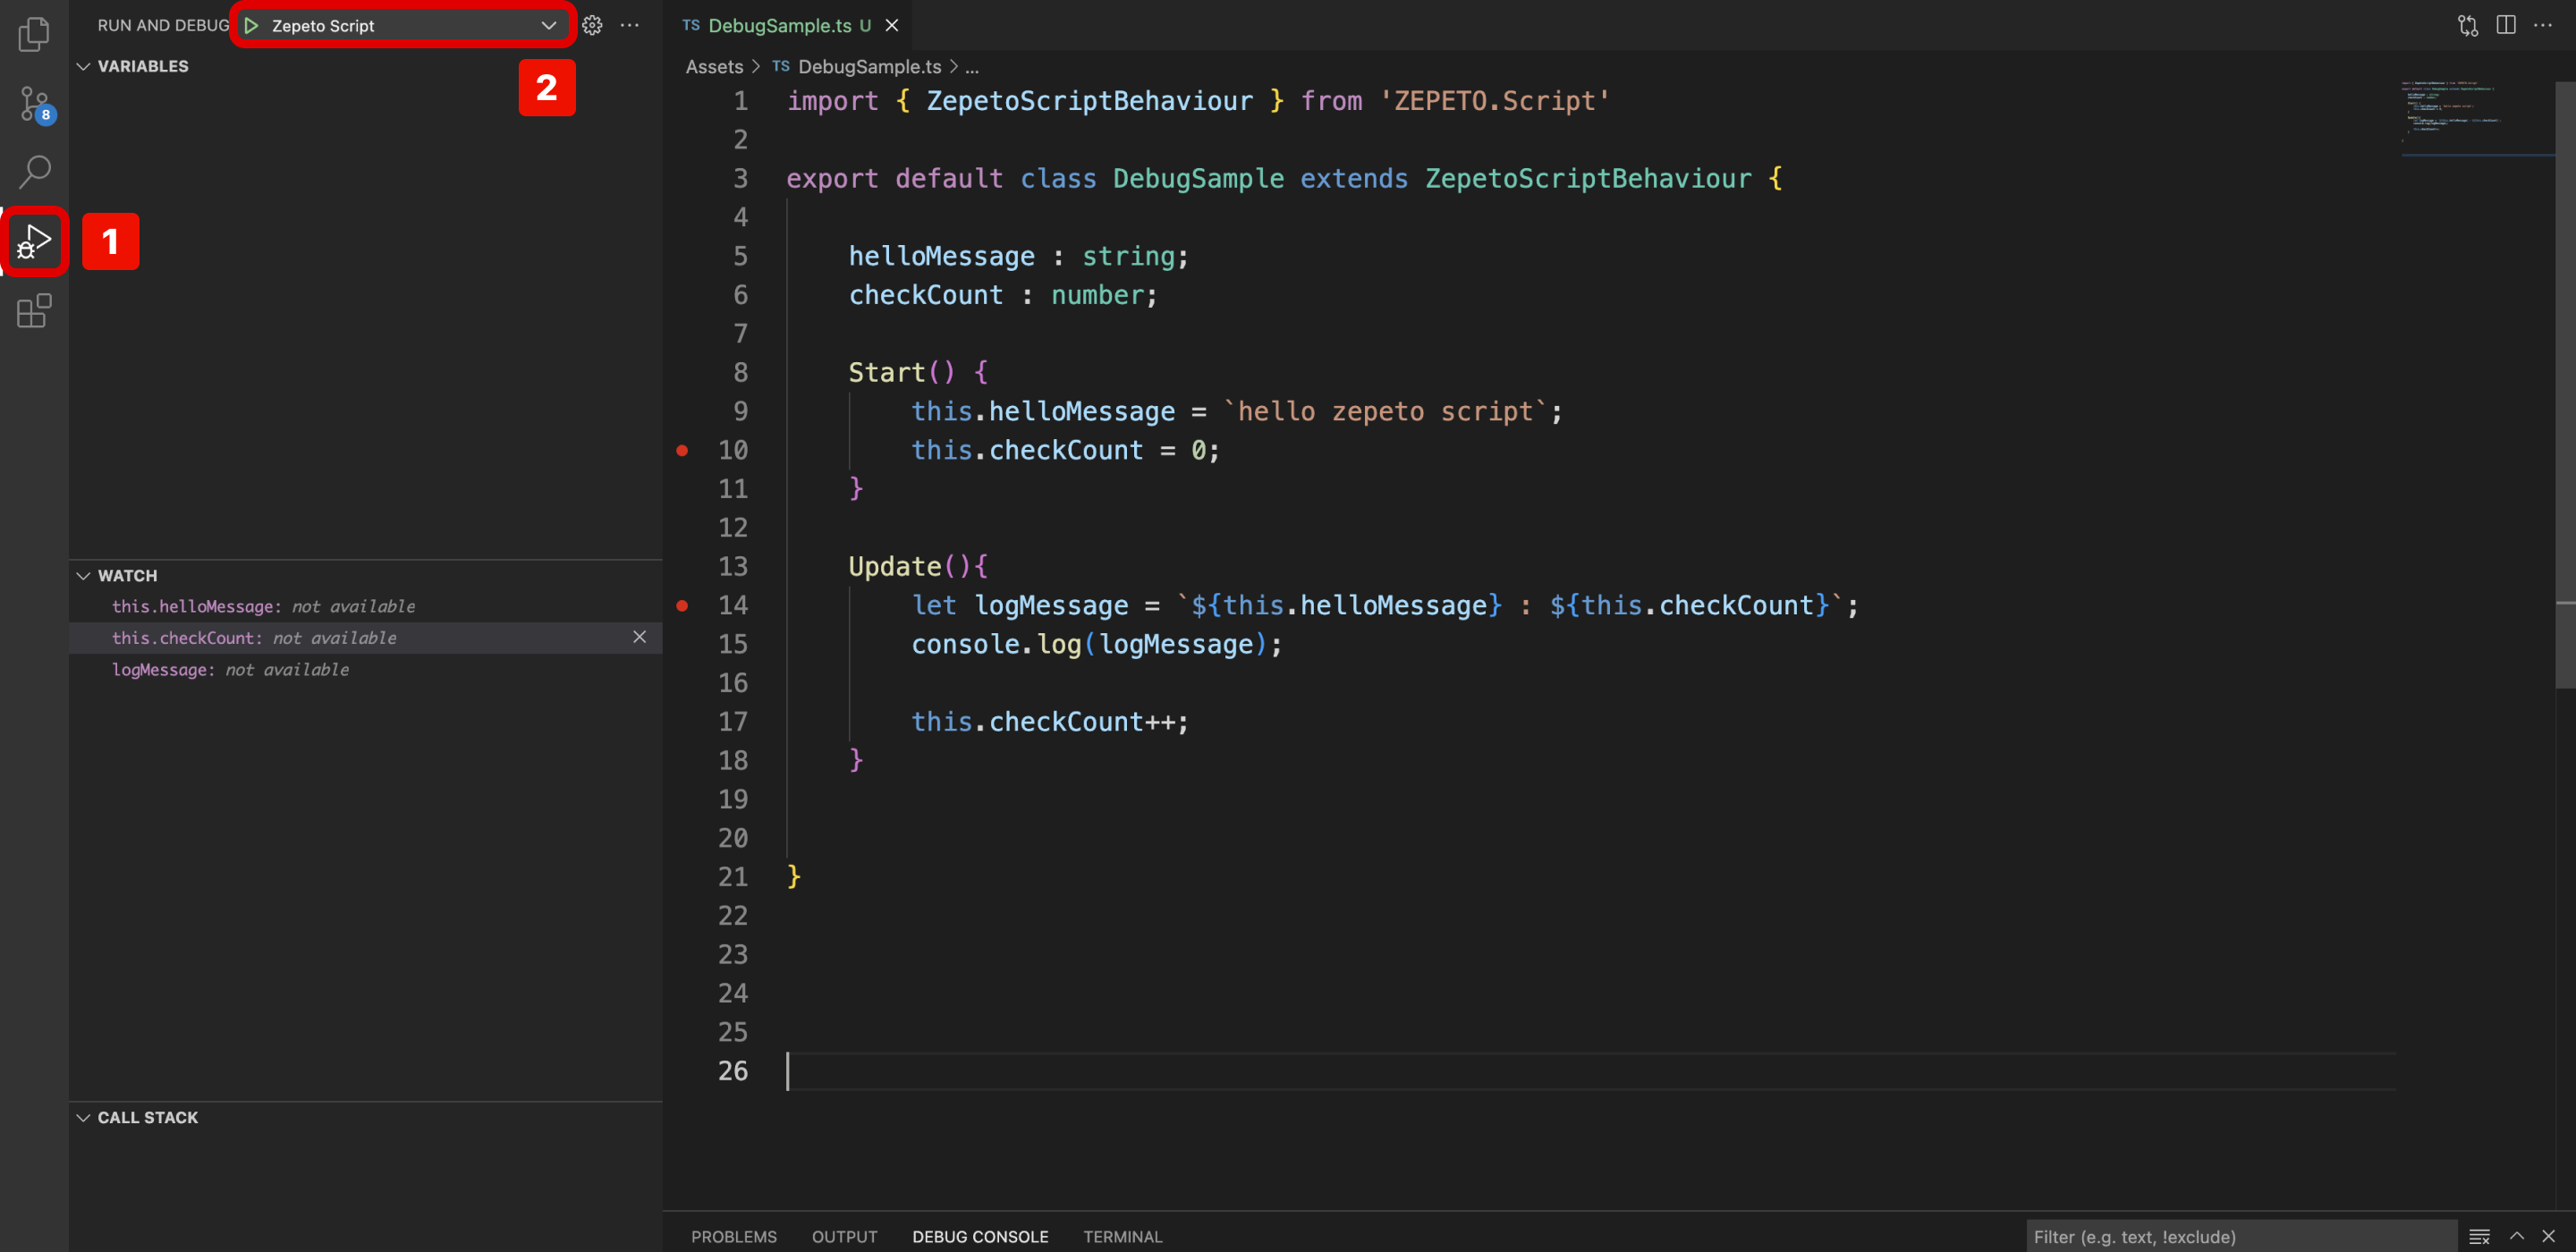
Play the Unity Editor, and click the ② Start Debugging button under the ① Run & Debug in the Visual Script Code.
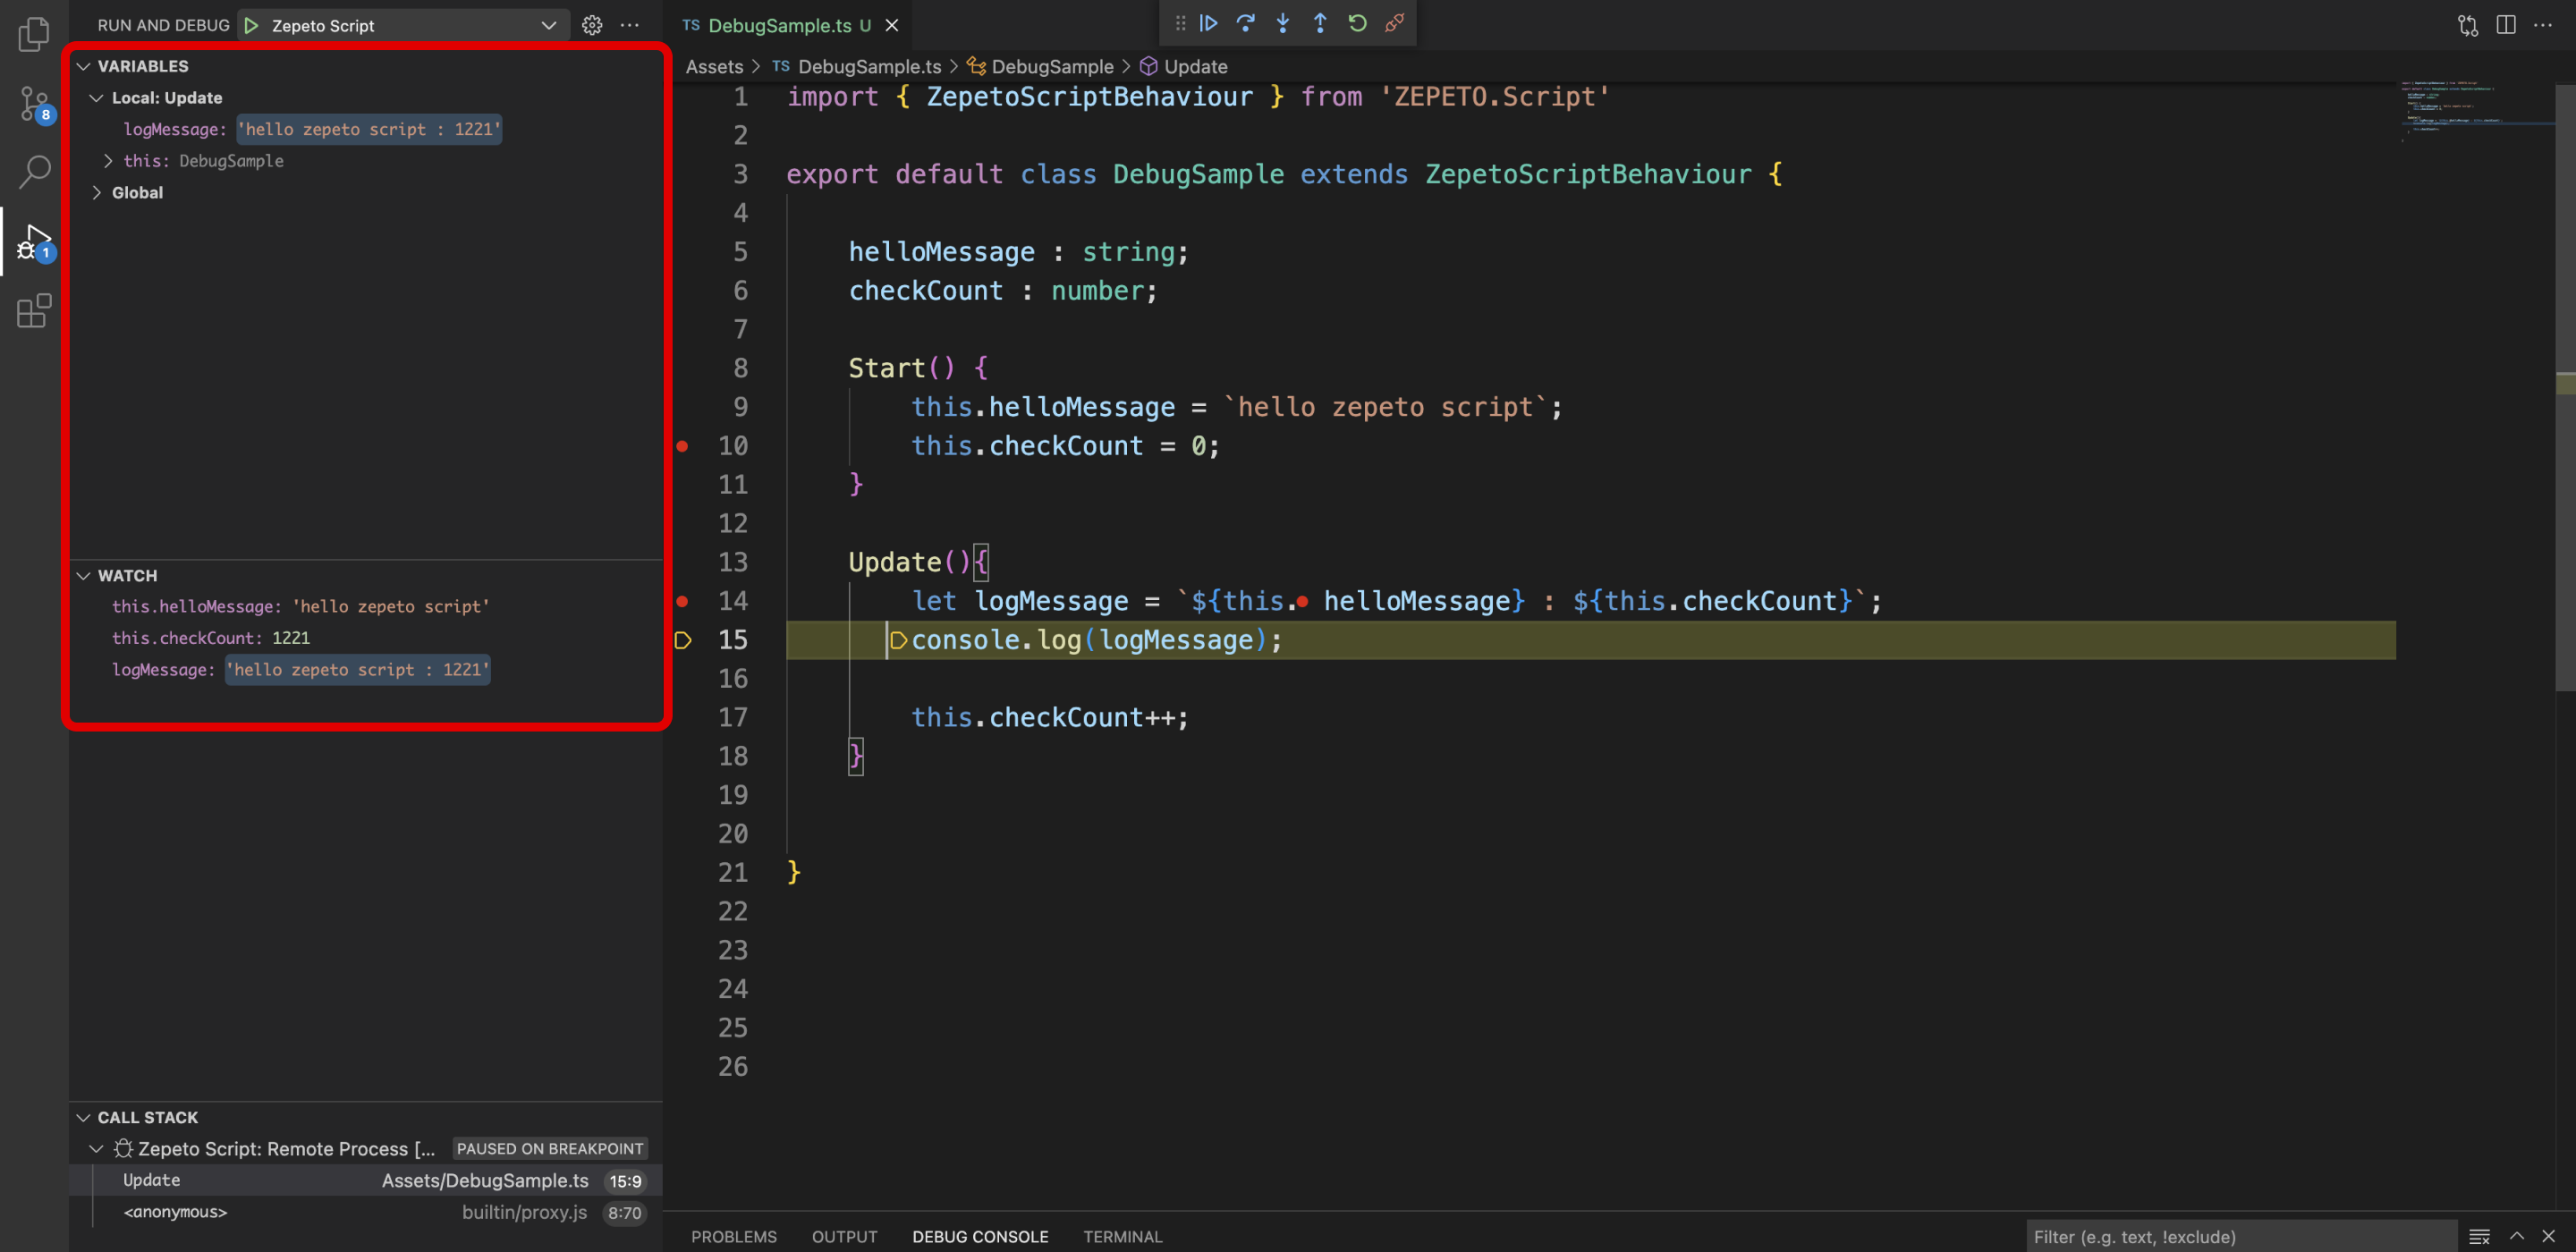
The Debugger is activated on the code line where the Breaking point is specified.
Debugging server code
Press the debug environment tab in the Debug panel with Zepeto Script selected at the top.
Change the debug environment to Zepeto Multiplay Script.
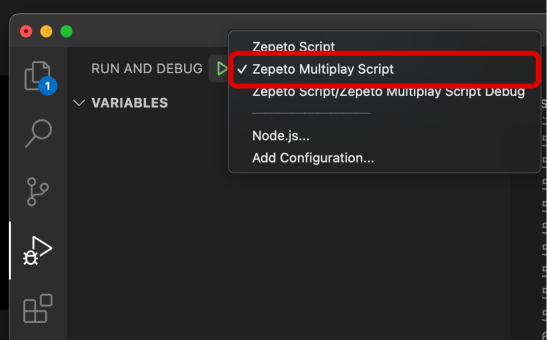
Click the StartDebugging button to start debugging.

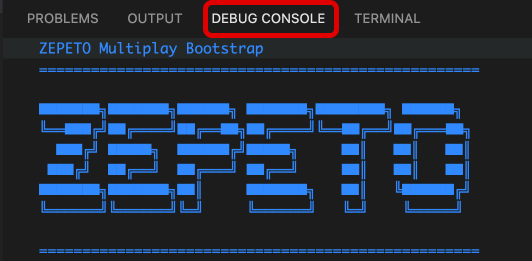
You can check the debugging by seeing the ZEPETO server logs displayed in the Debug Console panel.
