
With the official Runtime Profiler provided by ZEPETO, you can check various performance statistics, including memory consumption, of your world.
Caution
- The Profiler GUI is not customizable.
Using the Profiler in Unity Editor
- Please select the Unity > Window > ZEPETO > Show runtime profiler menu.
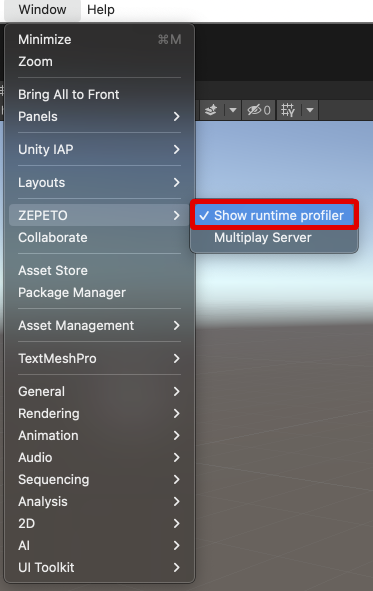
- Click the [▶︎(play)] button, and the profiler screen will appear in the editor.
- Both Horizontal and Vertical orientations are supported.
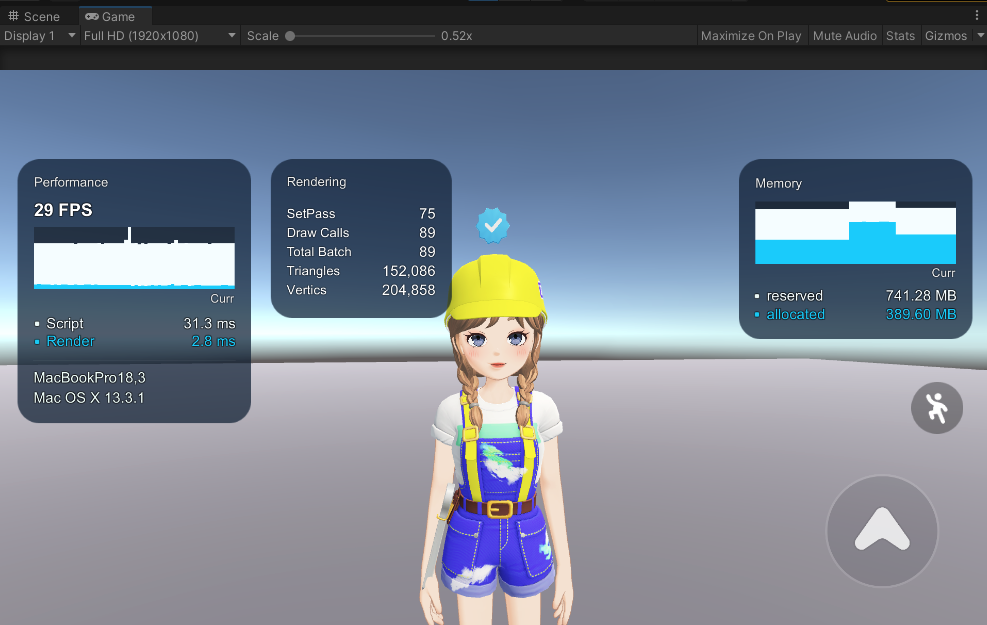
Unity Editor - Horizontal
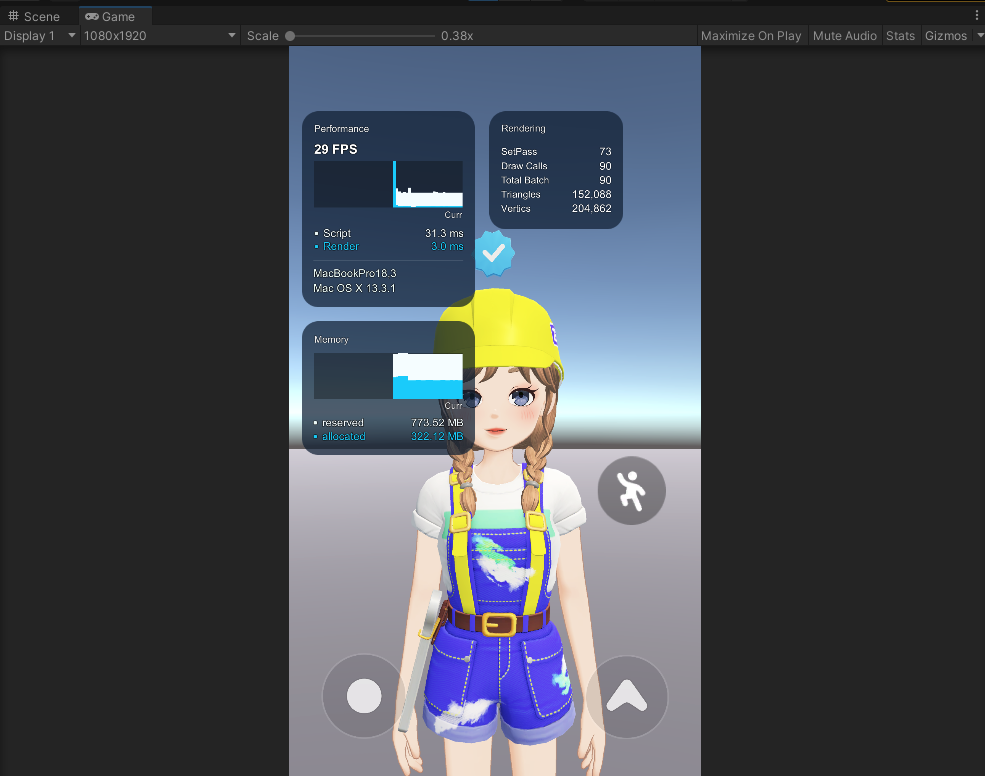
Unity Editor - Vertical
Using the Profiler in ZEPETO Mobile Test
- Click the home button and then click the settings button on the top right.
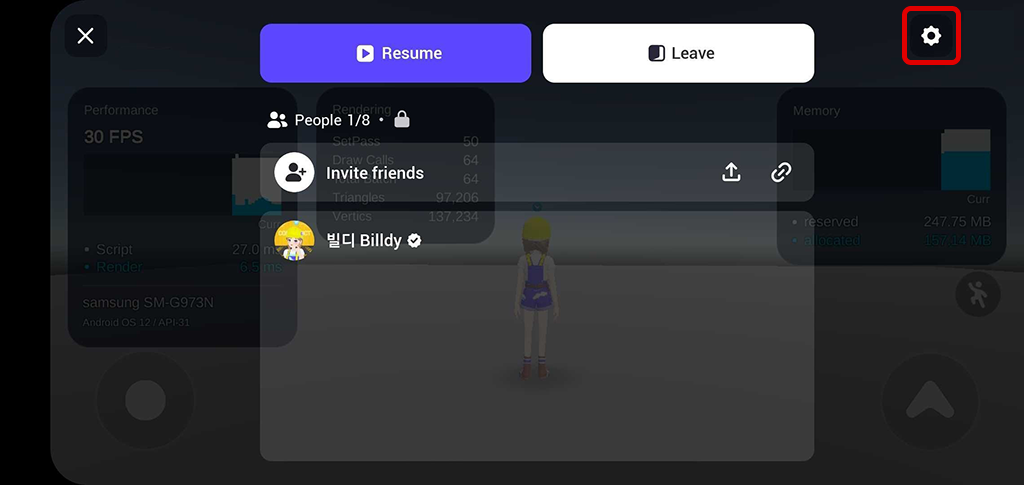
- In the settings menu, toggle the performance statistics to On.
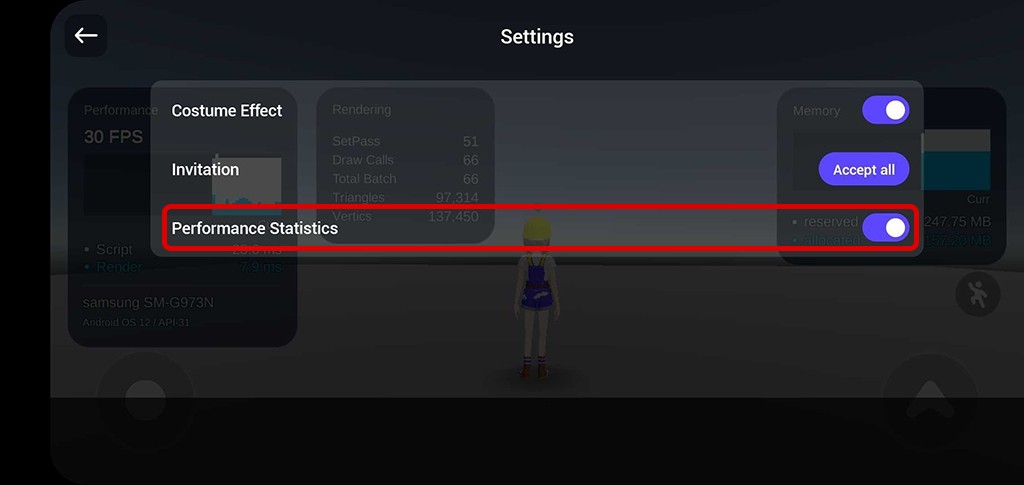
- The performance statistics GUI will appear on the screen.
- Both Horizontal and Vertical orientations are supported.
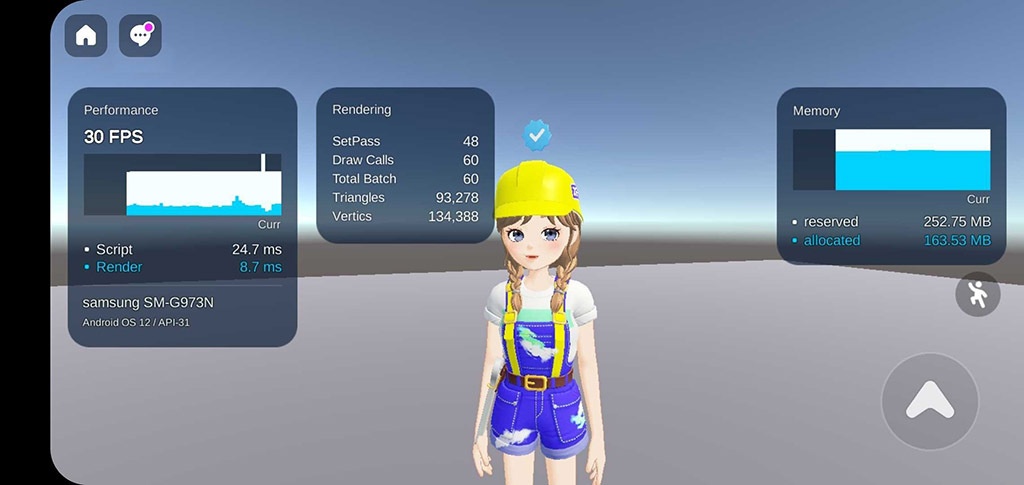
Mobile Test - Horizontal
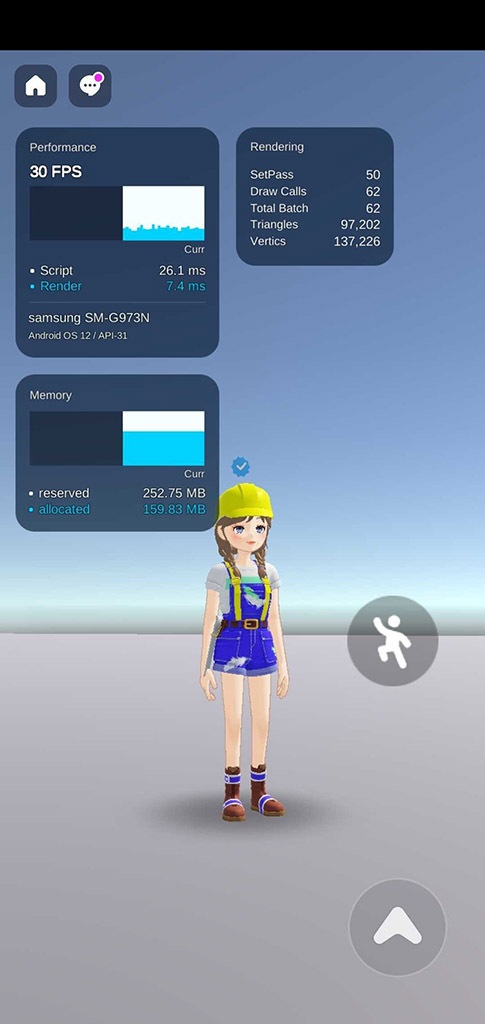
Mobile Test - Vertical
TIP
- Regardless of who created it, if a world is developed in Unity, you can use the performance statistics feature in any released world.
- In worlds that have been released, Rendering information is not disclose.
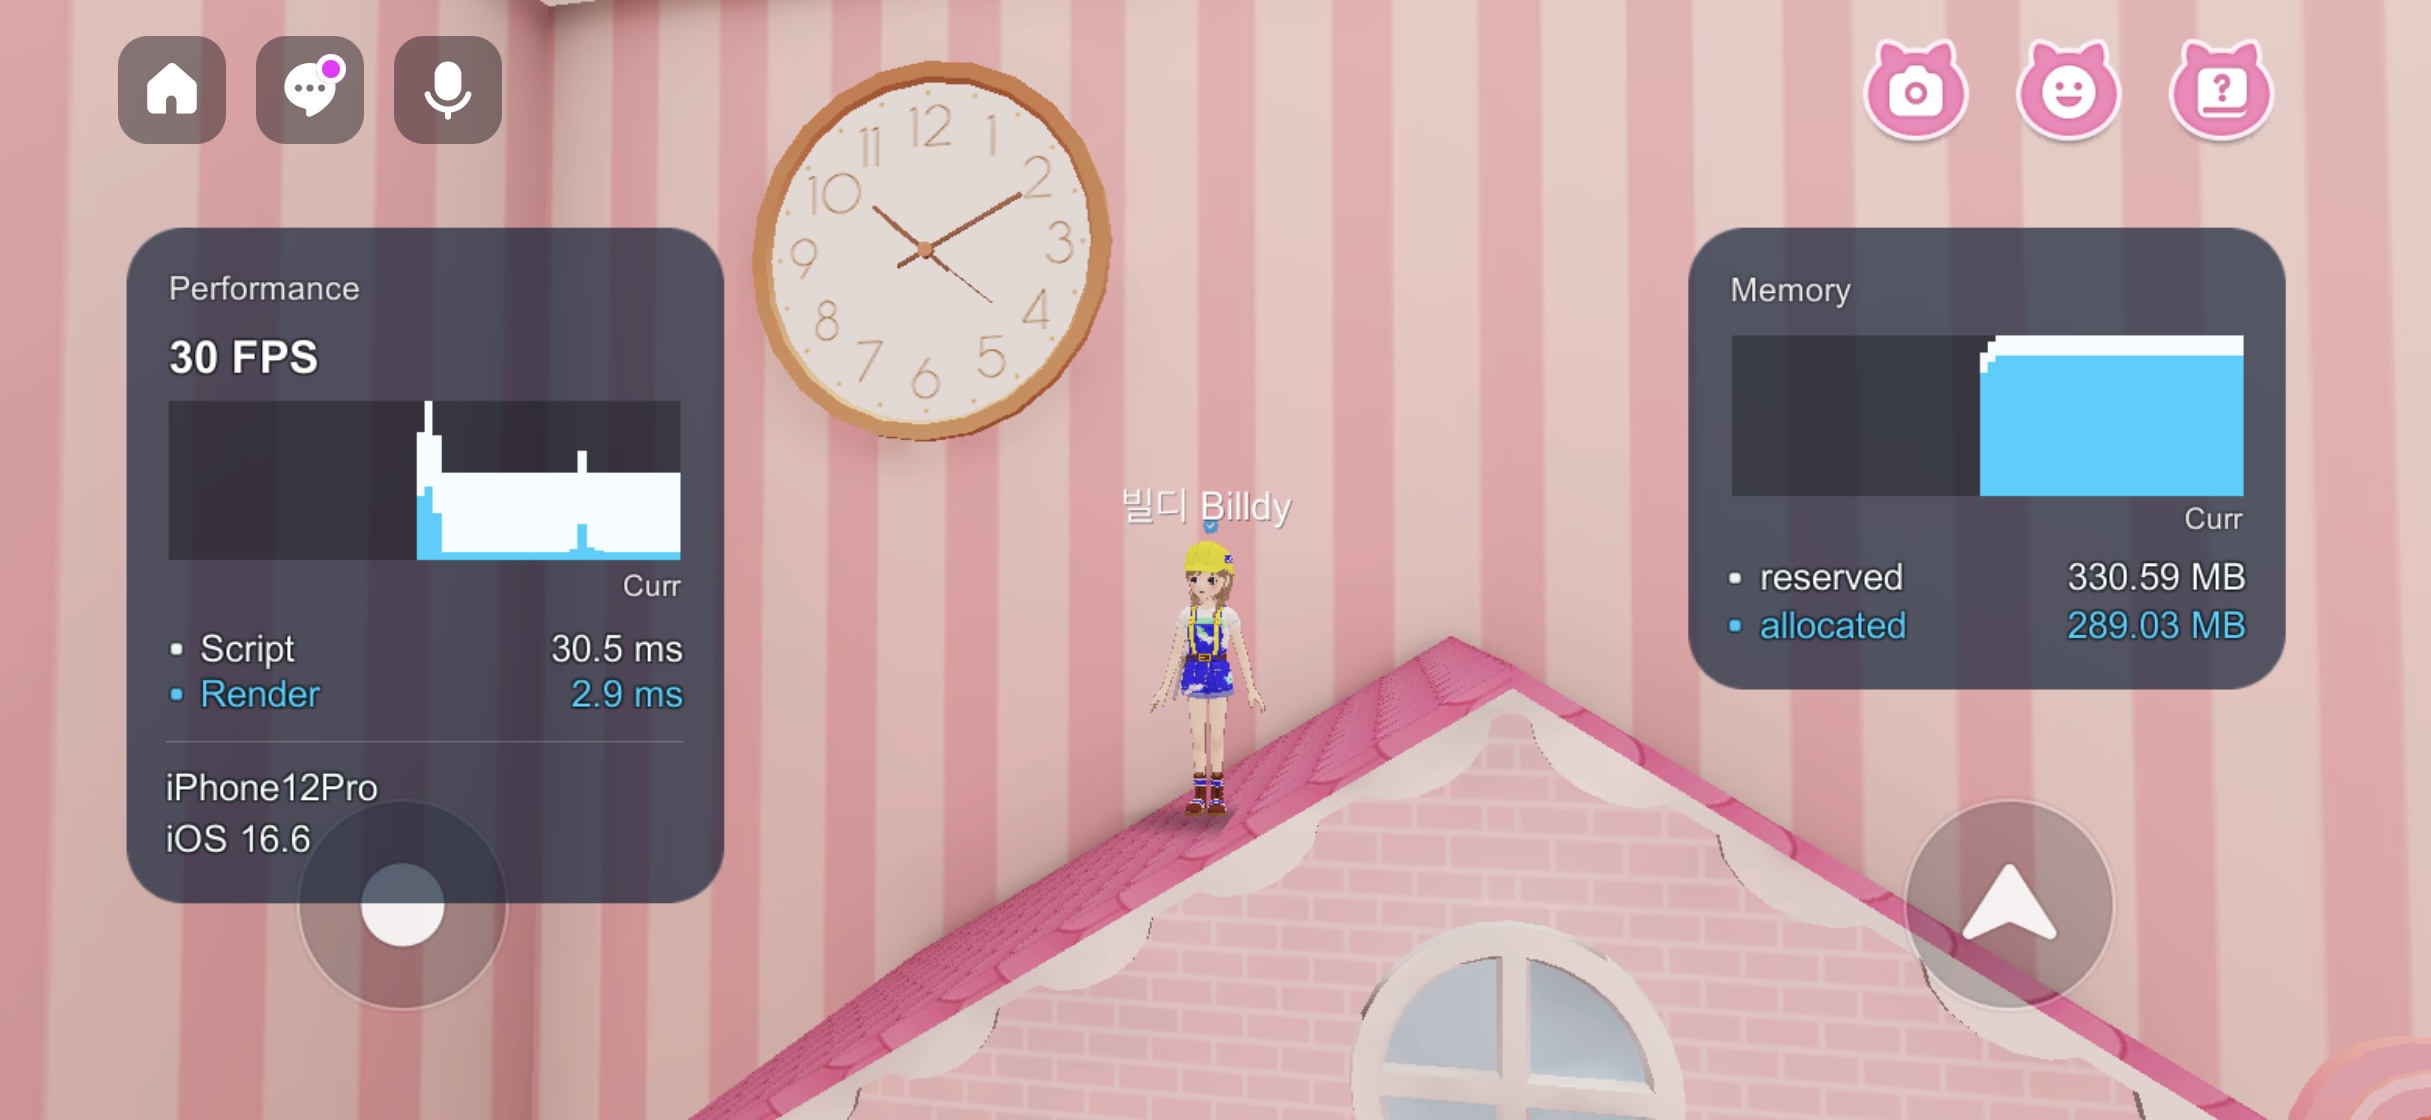
Information Available in the Runtime Profiler
Memory
- Monitor real-time memory allocation and usage.
| Property | Description |
|---|---|
| Reserved | Total memory reserved for the app by the OS. |
| Allocated | Memory allocated to the app by the OS. |
Performance
- Monitor real-time performance of the CPU and GPU.
| Property | Description |
|---|---|
| FPS | Information indicating the number of frames drawn per second. (ZEPETO limits this to a maximum of 30FPS.) |
| Script | The amount of time spent executing logic and scripts within the current FrameTime. |
| Render | The amount of time dedicated to rendering within the current FrameTime. |
System
- Check system information.
| Property | Description |
|---|---|
| Device | Device model name. |
| OS | Detailed information about the device's OS, including version. |
Rendering
- Real-time monitoring of rendering metrics.
| Property | Description |
|---|---|
| SetPass | Number of shader passes called when rendering one frame. |
| Draw Calls | Number of DrawCalls made when rendering one frame. |
| Total Batch | Total number of batches called when rendering one frame. |
| Triangles | Number of triangles processed when rendering one frame. |
| Vertices | Number of vertices processed when rendering one frame. |